Why bundles beat percentage discounts every time

Why bundles beat percentage discounts every time

Best viewed on desktop This article is built around full-width charts and data tables. On mobile they may appear truncated. For the complete picture, open this page on a desktop or tablet in landscape mode.

The Problem with Treating Volume as the Only Growth Lever

When founders want to grow, they often push more units of the same product. The reasoning is solid: “The product works. We just need more people to buy it. Run ads. Drive more traffic. Run discounts. Move higher volume.”

That, however, is only one of two valid growth levers. The other, often neglected, is to increase the average order value.

You see, when a customer has already arrived at checkout, the cost of getting them there has already been paid. Furthermore, the cost of getting the product to them is largely covered by the value of the first product in their cart. Any additional products added to the cart only add marginal shipping costs (if any) to the total order.

This is where increasing the average order value through bundles becomes an invaluable tool to unlock more profit. What’s more, bundles outperform percentage discounts on single products by a mile. They are incredibly effective at not only moving more stock, but also making more profit while offering the customer better value.

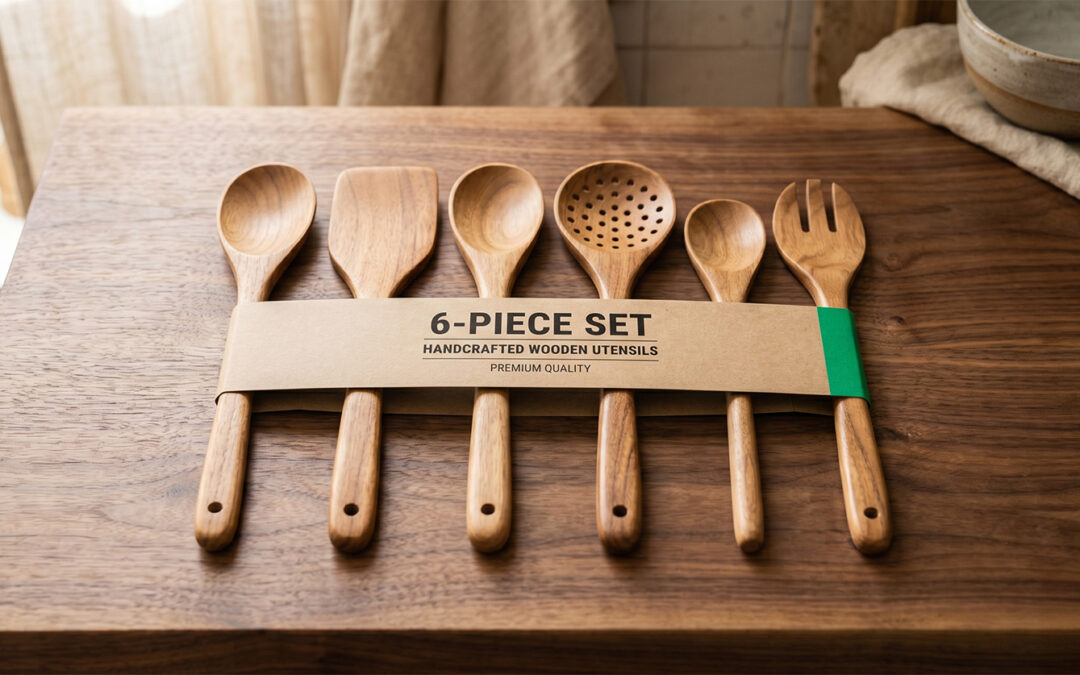
Bundles can take several shapes. They can be multiples of the same product — for example, buy two wooden spoons and get a third one free. They can also be a combination of multiple products — for example, a bundle containing a wooden spoon, turner, spatula, skimmer, mixing spoon, and salad fork.

Either of these bundle strategies allows you to increase your order value while offering the customer a better price per unit. Your customer pays less per unit, and you make more money overall.

To see why this works at the math level, we need to look at the six profit levers that move on every ecommerce sale:

The Six Profit Levers in Ecommerce
  1. Product cost What you paid to have it made and shipped into your warehouse.
  2. Discounts Often used to convince strangers to buy from you because you do not have a big brand yet.
  3. Returns Not only the money the customer gets back, but also the cost of getting the item back into your warehouse and re-stocked.
  4. Warehousing and outbound shipping to the customer 3PL storage allocation, pick, pack, and the courier cost to the customer’s door.
  5. Ad spend to drive traffic to the online store Google Ads, Meta, and the rest of your paid channels.
  6. Payment processor and channel fees Combined at the platform’s rate — approximately 3% on Shopify and similar direct ecommerce, 15% on Amazon, Walmart and other marketplaces.

Five of these six levers stay almost flat whether the cart contains one product or six. Only the Product cost lever scales with units. That asymmetry is what makes bundles win. This article will show you how to set up your bundles for success.

1. Example showing you the numbers

Imagine you sell wooden kitchen utensils on Shopify. Your hero product is a hand-finished wooden spoon you retail at $20 per unit.

To keep your conversion rate healthy you run a standing 10% sitewide discount across the whole catalogue.

Over the course of a week, three different customers each arrive at your store and buy a spoon.

You make a total of $3 contribution.

Per-order math at 10% off

Same calculation runs three times — once per customer.

Selling price (10% off $20)+$18
Product cost−$10
Ad spend−$3
3PL and outbound shipping−$2
Payment processor and channel fees (≈3%)−$1
Baseline returns−$1
Contribution per order+$1
Three customers, three orders$3

Now imagine you list a 3-pack of those wooden spoons as a bundle SKU at 20% off — twice the standing sitewide discount.

One customer arrives, sees the 3-pack and buys all three spoons in one order. The customer is delighted: they got an additional 10% saving on top of what they would have paid buying three single spoons.

And you? Well, you bank $9 of contribution instead of the $3 you would have made selling single spoons. That is a 3× in contribution despite giving away double the amount of discount. That is the power of bundles!

The wild bit is that it is the same product line. Same three spoons. But this one order absorbs the per-order costs once, not three times. One ad spend. One 3PL pick.

Bundle math at 20% off

Same three spoons, one order. Per-order costs apply once. Customer gets an extra 10% off.

Selling price (20% off $60)+$48
Product cost (3 spoons)−$30
Ad spend−$3
3PL and outbound shipping−$3
Payment processor and channel fees (≈3%)−$2
Baseline returns−$1
One customer buys a bundle$9

The Bundle Model

Four scenarios side by side. The first two show the apples-to-apples comparison on three spoons — three customers at 10% off versus one customer with a 20% off bundle. The second pair shows the same comparison on six utensils at the same discount structure.

Per-order economics — separate orders versus bundle orders
Line Item 3 separate single orders (10% off) 3-pack bundle (20% off) 6 separate single orders (10% off) 6-piece bundle (20% off)
Number of orders3161
Units sold3366
Customer pays (total)$54$48$108$96
Customer extra saving vs BAUn/a$6n/a$12
Product (COGS)$30$30$60$60
Ad spend (× orders)$9$3$18$3
3PL and outbound shipping (× orders)$6$3$12$4
Payment processor and channel fees (× orders, ≈3%)$3$2$6$3
Baseline returns (× orders)$3$1$6$1
Total cost$51$39$102$71
Founder contribution$3$9$6$25
The takeaway on bundles
  • The bigger the bundle set, the more margin you have to play with in terms of discount and the more money you stand to make.
  • Bundles deliver more contribution to the founder AND more saving to the customer at the same time.
  • Bundles eliminate per-order costs that would otherwise have been multiplied across separate orders.

The cost stack across all four scenarios

Each bar is the customer-paid revenue, broken into the cost layers from the bottom up. The green slice at the top is contribution. Notice how the bundle bars are shorter overall (customer pays less) but the green contribution slice is dramatically larger.

2. How to design a profitable bundle

Bundles are not so much a discount campaign as they are an order-consolidation strategy. The discount is what the customer sees. The eliminated per-order costs are what the founder banks. This is how you should treat them:

Strategic reframe

A bundle is a per-order cost saving in disguise.

The eliminated per-order costs are the value the bundle creates, and the founder gets to choose how to split that value between extra contribution and a deeper customer discount.

Six steps to design a bundle that scales contribution.

  1. Pick products customers already buy together. Look at your order history for items that co-occur in the same cart more than 8 to 10 percent of the time. For mixed bundles, this co-occurrence data is gold — it tells you which combinations the customer already wants. For multi-pack bundles, look at customers who reorder the same single unit within 30 days — they are telling you they would have bought the multi-pack if you had offered it.
  2. Test bundle size as a variable. Do not pick a bundle size by intuition. Run a 2-pack, a 3-pack, and a larger bundle (5-pack or 6-piece set) in parallel for two to four weeks. In most categories the optimal bundle size is bigger than the brand’s first instinct. Bigger bundles produce bigger per-order contribution; customers are often willing to commit to more units than you think.
  3. Model the contribution before you launch. Same six-lever model you would use on any campaign, with payment processor and channel fees combined at the platform’s rate — 3% for Shopify and similar direct ecommerce, 15% for Amazon, Walmart and other marketplaces. If contribution per order at the proposed bundle size and discount beats the separate-orders baseline, ship it. If not, change the bundle, change the discount, or kill the campaign at the model stage.
  4. Make sure the bundle’s per-unit price is lower than the single unit’s per-unit price. On Amazon and Walmart it is common to find 3-packs listed at a higher per-unit cost than the single. The customer notices. The conversion suffers. Always check the math from the customer’s perspective.
  5. Run a 2-week test before scaling. Watch the order count, the contribution per order, and the return rate. Bundle return rates sometimes run slightly higher than single-unit rates because the customer is less certain about committing to multiples. Make sure your model held up before you commit your inventory.
  6. If you are selling on a marketplace like Amazon, make sure you are the brand owner. You do not want to continually be fending off other sellers who try to undercut you on listings you created. The only way to do that is to join the Brand Registry.

3. Frequently asked questions

Multi-pack or mixed bundle: which strategy works best?

Both work, but they win different customer segments. Multi-pack bundles win with customers who already love your hero product and will use multiple units — think consumables, replenishment categories, gifts. Mixed bundles win with customers who are buying for a use case rather than a single product — think starter kits, completing a kitchen, themed sets. Most brands should run both. The multi-pack wins on the hero product’s repeat-buy base; the mixed bundle wins on first-time buyers who are buying for a category, not a SKU.

Won’t bundles cannibalise full-price single-unit sales?

This is the most common objection and it needs a real test, not a guess. Bundle buyers are usually a mix of two groups: customers who would have bought the same products one at a time across separate visits (cannibalised), and customers who would not have bought the full volume at all without the bundle value (incremental).

The cannibalised half is not pure cost. In our worked example, three separate single-unit orders at the standing 10% discount generate $3 of contribution; one 3-pack bundle at 20% off generates $9. Even if every bundle buyer would have come back to buy three single units individually, the founder still earns $6 more on that customer because the bundle absorbs per-order costs once instead of three times. The incremental half is pure win — the customer bought three units instead of one because the bundle made it appealing.

Run a controlled holdout test if you want certainty. Put the bundle in front of a randomised half of your traffic for two weeks. Compare total contribution per visitor against the held-out half. Most brands find the math works decisively in favour of bundling.

What if I sell on Amazon or Walmart instead of Shopify?

The bundle math still wins, but the cost stack shifts. On Shopify and similar direct ecommerce platforms, the combined Payment processor and channel fees line is roughly 3% of order revenue. On Amazon, Walmart, and other marketplaces, the same line is roughly 15% of revenue because the marketplace’s success fee includes the payment processing. That changes the headline contribution but not the structural insight: per-order costs still get multiplied when orders multiply, and bundles still consolidate them. Bundle SKUs on marketplaces should be enrolled in Brand Registry where possible — Brand Registry gives you control of the Buy Box so competing third-party sellers cannot undercut your bundle on the same listing.

Do I need separate SKUs for bundles or can I just combine in the cart?

Separate SKUs almost always win. In fact, on marketplaces they are essential. A dedicated bundle SKU lets you control the unit cost, the pack-out at the 3PL, the listing imagery, the customer-facing price, and the discount logic without affecting the single-unit SKU. Cart-based bundling (where the customer adds 3 units and a discount applies at checkout) is simpler to set up but messier in the books — the 3PL picks 3 separate units instead of 1 pre-packed bundle, channel fees apply differently, and tracking the bundle’s contribution becomes harder.

What if customers only want one item?

Keep the single unit available. The bundle is an alternative, not a replacement. Customers who want one will buy one and the founder still earns $1 of contribution per order at the standing 10% sitewide discount. Customers who see the bundle math and want the savings will buy the bundle and the founder will earn dramatically more. You want both segments converting — they just produce different per-order economics.

How deep should the bundle discount go?

Deep enough to be visibly better than the standing sitewide discount, but not so deep that it eats more contribution than the per-order cost savings created. Remember the goal is to make more profit. You want to give away as little as possible and make as much as possible, but it is a balancing act. The sweet spot is usually splitting the cost saving roughly evenly — half to the customer (a deeper discount), half to the founder (extra contribution). That keeps both sides happy and makes the bundle feel like a clear deal to the customer.

Can I stack bundle discounts with other promotions?

Be careful. Stacking discounts (a bundle discount on top of a sitewide promotion code, or both on top of an abandoned-cart code) is one of the most common ways founders accidentally turn a profitable bundle into a loss-making one. Run the contribution math on the worst-case stacked scenario, not just the bundle alone. If the stack still produces positive contribution per order, ship. If not, exclude bundle SKUs from sitewide promotions. In our Profit Playbook we cover the stacked-discount risk in more detail.

4. Quick reference: what to avoid and what to apply

What to Avoid
  • Comparing a bundle’s economics against a single-unit order — apples-to-apples means comparing against the equivalent number of single-unit orders at the standing sitewide discount.
  • Running additional stacked discounts on top of your bundle discounts.
  • Setting bundle size by intuition instead of testing 2-pack, 3-pack and larger bundles in parallel.
  • Pricing the bundle at the same per-unit price (or higher) than the single unit.
  • Treating bundles as discount campaigns rather than order-consolidation strategies.
  • Launching a bundle without checking the contribution per order on the model first.
What You Should Do
  • Build a six-lever bundle model in Excel or Google Sheets before launch, with payment processor and channel fees combined into one line at the platform’s rate.
  • Compare bundle contribution against the equivalent number of single-unit orders at the standing sitewide discount.
  • Set the bundle discount deep enough to feel meaningfully better than the standing sitewide discount, but not so deep that it eats more than the per-order cost saving the bundle created.
  • Pick bundle products from order-history co-occurrence (8 to 10 percent of carts).
  • Test 2-pack, 3-pack, and larger bundles in parallel for two to four weeks.
  • Use separate SKUs for bundles rather than cart-based bundling.
Definitions, modelling notes, and rate-basis disclosures Click to expand — benchmarks and assumptions used in the worked example above.
Definitions
  • Selling Price in this article is held at $20 per single unit (the wooden spoon) at full retail. With the standing 10% sitewide discount applied, the customer pays $18 per single unit at checkout. The 3-pack bundle at 20% off lands at $48 (from $60 retail). The 6-piece utensil set at 20% off lands at $96 (from $120 retail).
  • The six profit levers in this framework: (1) Product (COGS — landed product cost per unit), (2) 3PL and outbound shipping, (3) Ad spend, (4) Returns, (5) Discounts, (6) Payment processor and channel fees (combined).
  • Gross Profit equals Sell Price minus COGS.
  • Contribution per Order is Sell Price minus all six lever costs. It is what is left to cover fixed costs (rent, salaries, software, founder pay) and profit.
  • Per-order costs are the four cost lines that apply once per checkout regardless of unit count: Ad spend, 3PL and outbound shipping, Payment processor and channel fees, Baseline returns.
  • Payment processor and channel fees is a combined line representing the platform-level fee structure. On Shopify and similar direct ecommerce platforms this is approximately 3% of revenue (Shopify Payments at 2.9% plus 30 cents per transaction). On Amazon, Walmart, and other marketplaces it is approximately 15% of revenue because the marketplace’s success fee includes payment processing.
  • Multi-pack bundle is a bundle containing multiple units of the same product (for example, three wooden spoons).
  • Mixed bundle is a bundle containing different but related products (for example, a 6-piece utensil set).
  • Cannibalisation is the share of bundle sales that would have happened as separate single-unit orders without the bundle being available. Incremental sales are bundle sales that would not have happened at all without the bundle.
Modelling notes
  • All costs in the master table are stated as totals per scenario, with per-order costs multiplied by the number of orders the customer placed (3 for the three-spoon BAU, 6 for the six-utensil BAU, 1 for each bundle).
  • The BAU scenario includes a 10% standing sitewide discount — this represents the realistic baseline state for most ecommerce brands rather than pure full-price selling.
  • The bundle scenarios are offered at a deeper 20% discount — twice the standing sitewide rate. The deeper discount is what gives the customer a visibly better deal; the per-order cost amortization is what funds it.
  • The wooden kitchen utensil profile used here has 50% COGS and 50% Gross Profit at full retail. Different categories use different ratios. Plug in your own.
  • 3PL and outbound shipping scales modestly with bundle size — $2 single, $3 3-pack, $4 6-piece set — reflecting the slight increase in pick, pack and carton size as units increase.
  • Payment processor and channel fees rounds to clean dollar values per the Shopify Payments formula (2.9% + 30 cents): $1 at $18, $2 at $48 and $54, $3 at $96 and $108.
Rate-basis disclosures
  • Product (COGS): $10 per unit at $20 retail. Held fixed per unit and scales linearly with bundle size.
  • Ad spend: $3 per order. Held flat across all scenarios in this teaching model.
  • 3PL and outbound shipping: $2 single, $3 3-pack, $4 6-piece set.
  • Payment processor and channel fees: approximately 3% of revenue on Shopify (Shopify Payments at 2.9% plus 30 cents per transaction). Rounded to: $1 on $18 single, $2 on $48 3-pack, $2 on $54, $3 on $96 and $108.
  • Baseline returns: $1 per order (roughly 5% of single-unit revenue at the standing 10% discount).

CronosNow: Numbers you can trust. Info you can use. Insights you can action.

Why 25% off could be a 0% profit sale (and how to spot it before launch)

Why 25% off could be a 0% profit sale (and how to spot it before launch)

Best viewed on desktop This article is built around full-width charts and data tables. On mobile they may appear truncated. For the complete picture, open this page on a desktop or tablet in landscape mode.

The Problem with Borrowing Retail Discount Math

When founders use discounts, they believe they can sell more units at a smaller profit margin and therefore make more money in total. In their minds, selling more units makes more money in total.

This belief is strengthened by watching how much money big-box retailers like Walmart and Costco make each year. If they do it, it must work, right?

The problem is that retail discount math is very different from ecommerce discount math. They are not the same.

In retail, sales often only have two variable cost line items: the product cost and the credit card fee. That is it. If you cut 25% off the price you still walk away with money.

In ecommerce, the same sale can have up to six variable cost line items. We call these the Six Profit Levers:

The Six Profit Levers in Ecommerce
  1. The product cost What you paid to have it made and shipped into your warehouse.
  2. Discounts Often used to convince strangers to buy from you because you do not have a big brand yet.
  3. Returns Not only the money the customer gets back, but also the cost of getting the item back into your warehouse and re-stocked.
  4. Warehousing and outbound shipping to the customer 3PL storage allocation, pick, pack, and the courier cost to the customer's door.
  5. Ad spend to drive traffic to the online store Google Ads, Meta, and the rest of your paid channels.
  6. Payment processor and channel fees Card fee plus any platform commission on the captured amount.

Since all six of these levers take a slice of the profit you make on each sale, you need to keep them all in mind before you run any promotion that uses a discount.

In this article, you will learn how to model your own discount campaign so you actually make more money.

1. Example showing you the numbers

Your Shopify skincare store

Imagine you own a Shopify store that sells skincare products. Your best product is a face cream you sell for $100 per jar.

For the last six months you have been using free shipping plus a 10% discount coupon to get new customers to buy from you. See the numbers on the adjacent table.

Your bank balance showed you that you were making money.

You get the idea of running a 25%-off Black Friday promotion. The assumption you are working on is that if you move more stock, you will make more money.

What you think happens on each sale

You apply retail math to your Black Friday sale: drop the price by 25%, pay for the product, keep the rest.

Selling price+$100
Campaign discount (25%)−$25
Product cost−$40
You think you keep$35

The promotion runs

Black Friday rolls around and you ramp up your Google Ads and Meta advertising. Since you are chasing volume to make more money, you make sure you drive enough traffic to your store.

What you don't realise is that you missed crucial costs in your profit calculations. Since you forgot to account for ad spend, shipping, baseline returns and your payment processing fees, you end up losing $10 per sale. Instead of making money you are now making a loss.

In reality, when you were running free shipping and giving a 10% discount, you were only making $5 per sale — but because you did not factor in all your costs, you were quietly running a thinner margin than your bank balance was suggesting.

What actually happens on each sale

Once you load all six profit levers into the math, the picture changes. The same Black Friday sale, with the lines underneath included.

Selling price+$100
Campaign discount (25%)−$25
Product cost−$40
Ad spend−$25
3PL and outbound shipping−$12
Baseline returns−$5
Payment processor−$3
You actually lose−$10

The Discount Model

Here is the same skincare order modelled at six discount tiers, holding every other lever flat. Read the contribution row at the bottom — that is the only number that matters.

Line Item 0% 5% 10% 15% 20% 25%
Selling price$100$100$100$100$100$100
Product (COGS)$40$40$40$40$40$40
Gross Profit$60$60$60$60$60$60
Discount$0$5$10$15$20$25
Ad spend$25$25$25$25$25$25
3PL and outbound shipping$12$12$12$12$12$12
Baseline returns$5$5$5$5$5$5
Payment processor$3$3$3$3$3$3
Contribution per order$15$10$5$0−$5−$10

How the costs stack

The cost stack at each discount tier — where the $100 goes

The dashed line marks the $100 selling price. When the cost stack rises above the dashed line, you are losing money on every sale. Notice the crossover at exactly 15%.

Read the bottom row. Every 5% of discount costs you $5 of contribution per order. By the time you hit 15% off, contribution is at zero — the order is a wash. Past 15%, every sale loses you money. The 25% Black Friday promotion turns into a $10 loss on every single jar shipped.

Three patterns to spot on the chart:

  1. The discount slice grows at every tier.
  2. The fixed-per-unit levers underneath (product, ad spend, warehousing and shipping, payment processor) do not move at all — they sit there absorbing nothing.
  3. The cost stack crosses the $100 selling-price line at exactly 15% off. That is the threshold. Past it, every order is a loss, and the loss grows by $5 for every additional 5% of discount.

2. How to model your discounts

Discounts are not inherently bad. They are a useful tool, but they need to be used with discipline. This is how you should treat them:

Discounts should be viewed as a type of advertising cost.

Discount per order $25
+
Ad spend per order $25
=
True cost to acquire $50

It is best to look at discounts and ad costs together since the total is your effective cost of acquiring the customer. At 0% off you are paying $25 per order to acquire the customer. At 25% off you are paying $50 — twice as much — for the same customer. If you would not double your ad budget overnight, do not double your acquisition cost by stacking a discount on top.

  1. Model before you implement. The best way to protect your profits is to model your discounts before you think of implementing them. To do that, you must have access to the other variable cost data.
  2. Build the model once. Excel or Google Sheets. Use the Six Profit Levers to build your own cost stack. The output is contribution per order at each discount tier.
  3. Run every campaign through the model first. Plug in the proposed discount. Read the contribution line. If it is negative, the campaign is a loss disguised as a sale. Either lift the price, lower the costs, or kill the campaign at the model stage. Not after the books close.
The Discipline

The discipline is not in the spreadsheet. It is in the rule: contribution per order is the number, not Gross Profit. If you check Gross Profit, every discount tier looks fine. If you check contribution, you see the floor.

3. Frequently Asked Questions

Won't more volume make up the difference?

"The discount will double our volume. Surely that covers a small loss per order?"

The objection lands in every campaign meeting. No. It does the opposite. An increase in volume compounds whatever the contribution per order is.

Say you sold 1,000 jars at full price. Contribution: $15,000. Now you run 25% off, volume doubles to 2,000 jars, and contribution per order is −$10. Total contribution: −$20,000.

The volume lift did not save you. It made the loss bigger. Every extra unit you sold increased the loss.

The principle: you cannot discount your way out of a six-lever cost stack with a one-lever discount strategy. Lift the price. Drop the cost. Model first. Pick one.

Won't a higher discount drive more sales?

There is a difference between higher volumes and more profit. Brands that are heavily reliant on discounts tend to train their customers to wait for discounts. They can create a negative feedback loop that eats into your profits. Furthermore, discount shoppers tend to be less loyal than regular shoppers. Campaigns with heavy discounts also see higher returns.

If I can't use discounts, what should I do?

Percentage-off discounts are not the only tools available to drive sales. In our Profit Playbook we discuss 6 additional ways, all of which are more profitable, to achieve similar sales results without having to resort to heavy discounts.

Should I not be modelling on Gross Profit?

No. Gross Profit is not a great tool for modelling contribution in an ecommerce business since it neglects to include the other profit levers such as returns, ad spend, 3PL and outbound shipping, and payment processing and channel fees.

What about stacking discounts? Can that work?

In theory, stacking discounts could work, so long as the total discount does not negatively impact the contribution. Practically, however, stacking discounts can be very dangerous. If a rule is set incorrectly, you can very easily lose money.

What about lifting prices? Do I always need a discount?

Lifting prices can be an excellent strategy to maintain contribution margins whilst still using discounts. The downside in heavily contested marketplaces like Amazon and Walmart could be a drop in sales volume. This drop can, however, sometimes be offset by better marketing collateral and content. You would need to see what works best for your business.

4. Quick Reference: What to Avoid and What to Apply

What to Avoid
  • Copying retail discount math without checking the levers underneath.
  • Forgetting that ad spend and discounts both contribute to the cost per acquisition.
  • Assuming volume rescues a loss-making campaign.
  • Modelling on Gross Profit instead of Contribution per Order.
  • Stacking discounts (campaign code on top of standing catalogue discount on top of abandoned-cart code).
What You Should Do
  • Build a one-page model with all six profit levers at different discount points so you can see how discounts affect contribution.
  • Run every campaign through the model before you press launch.
  • Make sure to update your model regularly with the latest information you get from your financials.
  • Stop any campaign that does not show positive contribution.
  • Fix contribution by lifting the price, dropping the discount, or killing the campaign. Not all three at once.
Definitions, modelling notes, and rate-basis disclosures Click to expand — variable cost benchmarks and assumptions used in the worked example above.
Definitions
  • The six profit levers in this framework: (1) Product (COGS – landed product cost per unit), (2) 3PL and outbound shipping, (3) Ad spend, (4) Returns, (5) Discounts, (6) Payment processor and channel fees.
  • Gross Profit equals Sell Price minus COGS.
  • Contribution per Order is Sell Price minus all six lever costs. It is what is left to cover fixed costs (rent, salaries, software, founder pay) and profit.
  • Baseline Returns is the share of revenue lost to expected returns across the catalogue.
  • Baseline Discount is the standing average discount applied across the catalogue before any campaign.
  • Payment Processor is the card and platform processing fee. Typically 2.9% plus 30 cents per transaction on Shopify Payments and Stripe.
Modelling notes
  • All costs in the master table are stated per order, held at clean integer dollars on the $100 sell price for teaching clarity.
  • The premium skincare profile used here has 40% COGS and 60% Gross Profit. Different categories use different ratios. Plug in your own.
  • Ad spend is held flat across tiers in this teaching model. In production models, ad spend often rises modestly at deeper discounts as the platform auction tightens.
Rate-basis disclosures
  • Product (COGS): $40 per unit. Held fixed across every discount tier.
  • 3PL and outbound shipping: $12 per order.
  • Ad spend: $25 per order.
  • Baseline returns: $5 per order (5% of revenue at full price).
  • Payment processor and channel fees: $3 per order.

CronosNow: Numbers you can trust. Info you can use. Insights you can action.

When a Blood Test Saves Your Business From Cardiac Arrest

When a Blood Test Saves Your Business From Cardiac Arrest

How bad can it really be?

I strutted into my annual check-up like a man ordering fries with a side of confidence. This was going to be a walk in the park. My plan was simple. I was going to grab my cholesterol pills, smile politely, and be out the door before you could say “blood pressure.”

Moments later, in walked my doctor—a five-foot-nothing woman, radiating warmth with a friendly smile that instantly put me at ease.

I’m six foot three and, shall we say, comfortably insulated. The optics were comical: me towering like a redwood, her peering up like a determined squirrel with a clipboard. We exchanged smiles. So far, so good.

She sat down, opened my chart… and the smile vanished. In its place: a pair of well-worn frown lines and an ominous silence that settled over the room like a cold fog.

Doctor (looking up at me): “Shaun, your BMI is off the charts—if they gave medals for mass, you’d be on the podium.”

Me (nervous chuckle): “Well… good to know I excel at something?”

Doctor: “Nice try. The healthy cholesterol range is 4. You’re sitting at 8. That’s a fast track to a heart attack if we don’t make changes.”

She may have been half my height, but her frankness towered over every flimsy excuse I tried to offer. What followed felt less like a check-up and more like a TED Talk with my life hanging in the balance. It was, without a doubt, a full-blown Come to Jesus moment.

The brutal truth was that a prescription might have nudged my cholesterol numbers, but the real culprit—midnight takeout, gold-medal desk-chair marathons, and the sad fact that the only “machine” I ever used at the gym was labeled vending—demanded a full lifestyle rewrite.

The “Just-Give-Me-the-Pill” Syndrome:

Founders often play the same game—just with their eCommerce businesses.

Faced with crumbling margins, cash flow crunches, or runaway ad spend, they reach for quick fixes like expensive short-term loans, last-minute air freight, or deep discounts to move stock fast—without making a cent of profit. Those things however never really fix the problem.

Why more capital can amplify a broken model and not fix it

When new money lands in your account, it’s tempting to hit the gas—bigger ad budgets, larger inventory orders, maybe a fancier 3PL. But if you’re already losing on every sale, scaling just multiplies the loss.

Think of it this way: if you keep 42 ¢ of every dollar after fees but spend 28 ¢ on ads, only 14 ¢ is left to cover everything else right? Pouring more cash into ads doesn’t widen that gap—it closes it faster. Revenue spikes, but your bank balance drops.

Extra funding can also hide red flags. Bigger orders tie up more cash in slow-moving stock, freight bills balloon, and warehouse fees stay high whether sales are hot or cold. By the time the capital runs out, you’ve built a larger, leakier ship.

That is why knowing your numbers is so critical. Without solid financials and the courage to actually look at them, you are in the dark, just like I was with my health.

Ten financial panels that reveal a hidden profit crisis

Doctors run panels; founders must run financial statements. Here are the financial “vital signs” you can’t skip. Print it. Stick it to the fridge. Consult it before buying that next pallet of “totally-will-go-viral” unicorn socks:

Vital Sign#1: Gross Profit Margin %

  • What it is: The percentage of revenue left after deducting the cost of goods sold.
  • Why it matters: It funds your advertising, overhead, and ultimately determines your profitability.
  • Target: 50%+ for DTC, 30-40% for resellers or wholesale
  • Warning Zone: Below 30% (limited room for ads, ops, profit)

Vital Sign#2: COGS % of Gross Revenue

  • What it is: The percentage of revenue consumed by your cost of goods sold.
  • Why it matters: High COGS limits gross profit and signals poor pricing or sourcing strategy.
  • Target: 30-50% depending on category
  • Warning Zone: Above 60% (indicates thin margin or inefficient sourcing)

Vital Sign#3: Break Even Point

  • What it is: The breakeven point, represents the revenue level at which total income equals total costs—resulting in zero profit or loss
  • Why it matters: It helps identify the minimum level of sales required to avoid losses and includes important insights such as margin of safety and contribution margin. A clear understanding of your breakeven point allows for better cost management, pricing strategy, and financial planning.
  • Another way to look at it: You can also calculate breakeven in terms of units sold: This tells you how many units you need to sell to cover all your fixed and variable costs. It’s especially helpful for product-focused businesses aiming to set volume goals or pricing strategies.
  • Target: Break-even within 3–6 months for new customer acquisition
  • Warning Zone: Beyond 12 months or unclear break-even point

Vital Sign#4: Advertising % of Gross Revenue

  • What it is: The portion of revenue spent on ads.
  • Why it matters: High ad spend without returns will crush profitability.
  • Target: 20-30%
    (depending on Life Time Customer Valie and margin)
  • Warning Zone: Above 40%
    (unless part of aggressive growth strategy)

Vital Sign#5: Shipping & 3PL (Net Shipping) % of Gross Revenue

  • What it is: The net cost of warehousing, fulfillment, and shipping as a share of revenue.
  • Why it matters: These costs eat into margin quickly, especially with free shipping offers.
  • Target: 5-15% depending on weight and region
  • Warning Zone: Above 20%

Vital Sign#6: Merchant Fees % of Gross Revenue

  • What it is: Transaction and platform fees taken by payment processors or marketplaces.
  • Why it matters: These fees reduce net revenue and can be significant at scale.
  • Target: 2-5%
  • Warning Zone: Above 6-7%

Vital Sign#7: Refunds % of Gross Revenue

  • What it is: The percentage of revenue lost to returns or refunds.
  • Why it matters: High refunds point to product quality or fulfillment issues.
  • Target: < 5%
  • Warning Zone: > 10% (product/CX problems likely)

Vital Sign#8: Discounts % of Gross Revenue

  • What it is: Revenue lost from offering price reductions.
  • Why it matters: Discounts can move stock but erode your margin if used excessively.
  • Target: < 10% long-term average
  • Warning Zone: > 15% (erodes brand and margin)

Vital Sign#9: Nett Profit Margin %

  • What it is: The percentage of revenue left after all expenses are paid.
  • Why it matters: It determines your true profitability and long-term viability.
  • Target: 10-20%
  • Warning Zone: Below 5% (unless reinvesting aggressively)

Vital Sign#10: Debt to Equity Ratio

  • What it is: A measure of how much debt you use relative to your equity.
  • Why it matters: High debt levels can strain cash flow and increase risk.
  • Target: < 1.5 (healthy leverage)
  • Warning Zone: > 2 (potential solvency risk or aggressive funding structure)

If you do not know where to get hold of these figures, you need help! Without these 10 indicators you are effectively flying blind.

The CronosNow ecommerce accountant Takeaway

I was lucky. That outspoken, pocket-sized doctor told me the truth I didn’t want to hear. She literally may have saved my life. Every founder needs the same kind of honesty in their business.

That’s where CronosNow comes in. We’ll straighten out your books, show you the figures that really matter, and deliver them with the necessary honesty.

An uncomfortable truth that buys you decades of success beats a comforting lie that ends in a catastrophic financial failure. Ready for the diagnostic? Book a consultation before your balance sheet flat-lines.


CRONOSNOW | CPG & ECOMMERCE ACCOUNTANTS
Gain Clarity. See the Path Ahead.

Eating into your profits: The Candy Bar Mistake That Kills eCommerce Brands

Eating into your profits: The Candy Bar Mistake That Kills eCommerce Brands

The next Willy Wonka?

In high school, I thought I’d cracked the code to easy money. I started buying popular candy bars in bulk and selling them at a markup to my classmates. Sales were strong, the margins looked ok, and I felt like a young entrepreneur on the rise.

But there was one problem—I loved those candy bars too much. After making a few sales, I’d reward myself by eating one… then two… because, hey, I deserved it. I was working hard, right?

Soon enough, my profits were gone, my inventory vanished, and the business collapsed. I wasn’t running a candy empire—I was literally eating my own profit.

Decades later, I see eCommerce sellers making the exact same mistake. Not with chocolate—but with poor cash flow habits that even a great ecommerce accountant could warn you about.

From Candy Bars to Capital Burns: The Modern Version of This Mistake

You might be hitting $100K, $500K, even $1M in revenue. Your gross profit margin might look good on paper. But if you’re pulling too much money out of the business to fund your lifestyle—luxury purchases, inflated salaries, or even just poor cash discipline—you’re eating your own profits. Just like I did.

It’s deceptively easy to do.

eCommerce businesses are cash-hungry. Between inventory deposits, ad spend, freight bills, and platform fees, the money you see in your bank account isn’t all yours to spend. And if you treat it like it is, you will starve the business of what it needs to survive: working capital.

What to Watch Below the Gross Profit Line

You might think: “My gross profit margin is strong, so I’m fine.” But your P&L (Profit & Loss statement) has a second act—below the gross profit line—where profit vanishes fast if you’re not careful. This is where a skilled ecommerce accountant can help you stay ahead of hidden risks.

1. Overpaying Yourself Too Soon

Drawing a large salary before your business can support it is a common early-stage mistake. Just because revenue is flowing doesn’t mean profit is.

2. Bloated Subscriptions & Overhead

A new app here, a new tool there—it adds up. Many sellers forget to regularly audit their tech stack and recurring expenses.

3. Ad Spend With No Profit Backing It

Ad platforms will take every dollar you feed them. But if you’re scaling ads on slim margins, you’re spending future profits you don’t yet have.

4. Big Inventory Orders Without the Margin to Support It

If your margins are too slim and you’re paying yourself out of the business, there may not be enough cash left for the next PO (purchase order). This is how businesses stall.

How to Set Realistic Financial Goals That Don’t Kill the Business

Setting smart financial goals isn’t about spreadsheets—it’s about survival. Many sellers get this wrong, but inventory accounting reveals the truth about how long your margins can fund your growth.

  • Pay Yourself a “Survival Salary”—Not a Vanity One
  • Know Your “Cash-Lock Window”
  • Budget for Operating Expenses Before You Pay Yourself
  • Build a 90-Day Cash Buffer

Your Gross Profit Is Not Your Paycheck

Gross Profit Margin is your business’s heartbeat—but it’s not your personal bank account. Respect the distinction.

If you’re unsure how much of your gross profit is actually available to withdraw, it might be time to rebuild your books on an accrual accounting foundation.

This allows you to match inventory costs with revenue properly, spot margin gaps, and avoid the illusion of profitability.

The CronosNow ecommerce accountant Takeaway

My candy bar hustle did not fail because of sales —but because I didn’t respect the margin. I let my personal cravings sabotage a profitable idea. Don’t make the same mistake with your business.

Your job isn’t to take everything the business earns.

It’s to make sure the business earns enough to thrive—and then pay you sustainably.

Feeling unsure if your business can support your salary—or if you’re just “eating your profit”? We help eCommerce sellers build clean books, forecast smartly, and pay themselves without sabotaging growth.


CRONOSNOW | CPG & ECOMMERCE ACCOUNTANTS
Gain Clarity. See the Path Ahead.

Why Bundles Could Be Saving Your Bacon. How to maximize your pick and pack fees

Why Bundles Could Be Saving Your Bacon. How to maximize your pick and pack fees

The Cost Trap: Why Selling One Apron Wasn’t Working

Sandra thought she had a simple business model—she sold aprons on Amazon. But when her bank balance didn’t match her growing order volume, she turned to CronosNow eCommerce Accountants. The surprise? a hidden profit leak tied to how she was selling her products, not just how many she was moving. The fix was shockingly simple—bundles.

When we analyzed Sandra’s SKU profitability, we noticed something incredibly common in eCommerce: her fulfillment cost per order was fixed, regardless of how many aprons she shipped.

  • FBA Pick & Pack Fees? Same whether it was 1 apron or 5.
  • Packaging, labeling, warehousing fees? Mostly fixed per shipment.
  • Customer service and return logistics? Didn’t scale linearly either.

In short, the cost to ship a single apron was nearly identical to the cost of shipping a 5-pack. Because she priced individual aprons too low—trying to stay “competitive”—her per‑unit margin was razor‑thin. Bundling turned fixed fees into profit amplifiers.

The core mechanic: Fulfillment cost is fixed per shipment, not per unit. Every additional unit in the same box improves your gross profit margin on that order — without adding meaningfully to your cost.

The Fix: Anchor Pricing and Bundles

The solution had two parts. First, Sandra needed to raise her single-unit price to anchor value. Second, she needed to introduce bundle tiers that made buying more feel like the obvious choice.

Step 1 — Raise the single unit price

Sandra was selling at $12.99. We helped her reposition at $18.99. This did two things: it established a clear value anchor in the customer's mind, and it set up a meaningful contrast when the bundle was introduced. Without a credible single-unit price, the bundle discount feels hollow. With it, the bundle feels like a genuine deal.

Step 2 — Introduce bundle tiers

With the anchor set, the bundles had something to contrast against. The 3-pack at $45 ($15 per apron) and the 5-pack at $65 ($13 per apron) both offered a lower per-unit price — but Sandra's gross profit per order rose sharply because the fixed fulfillment cost was now spread across more units and more revenue.

Step 3 — Upgrade the listing to match the price

Sandra didn't just raise her price and wait. She invested in better product photography, rewrote her descriptions with a stronger brand voice, and added comparison tables that highlighted the premium features of her aprons. The listing didn't just look more expensive — it looked worth more. She began attracting customers buying for quality, not just price.

The Numbers: What Changed

Here is the before and after in Sandra's unit economics, using her actual bundle tiers:

Bundle Sale Price Per-Unit Price COGS (total) Fulfillment Gross Profit GP Margin
Single apron (old price) $12.99 $12.99 $4.50 $4.00 $4.49 34.6%
Single apron (new price) $18.99 $18.99 $4.50 $4.00 $10.49 55.2%
3-pack $45.00 $15.00 $13.50 $4.25 $27.25 60.6%
5-pack BEST GP $65.00 $13.00 $22.50 $4.25 $38.25 58.8%
$4.49
GP Before
Single Unit
$10.49
GP After
Single Unit
$27.25
GP Per Order
3-Pack
$38.25
GP Per Order
5-Pack

Gross Profit Per Order: Visualised

The chart below shows gross profit dollars and GP margin across all four pricing scenarios. The story is clear — bundling converts fixed fulfillment cost from a margin killer into a margin amplifier.

Gross Profit ($) vs GP Margin (%) — Across All Bundle Tiers

The Gross Profit Formula

Before launching any bundle, always model it at the order level — not the unit level. Here is the calculation Sandra's team now runs on every new bundle configuration:

Bundle Gross Profit Model — 5-Pack Example
Gross Revenue (sale price)$65.00
Landed COGS (5 units × $4.50)− $22.50
FBA / Channel Fee (est. 8%)− $5.20
Fulfillment / Pick & Pack (fixed)− $4.25
Discounts applied$0.00
Gross Profit$33.05

Cost Breakdown: Where Every Dollar Goes

This stacked view shows exactly how each cost layer consumes revenue across Sandra's four pricing scenarios. Watch what happens to the green gross profit bar as the bundle grows — the fixed fulfillment cost becomes an increasingly small share of revenue.

Revenue Breakdown Per Order — COGS, Fees, Fulfillment & Gross Profit

Per-Unit Price vs Gross Profit Per Order

This is the counter-intuitive core of bundling. As the per-unit price the customer pays falls, your gross profit per order rises. The two lines move in opposite directions — and that divergence is the entire profit opportunity Sandra was sitting on without knowing it.

Per-Unit Price (Customer Pays) vs Gross Profit Per Order (Sandra Keeps)

But What About Losing Sales?

"If Sandra raised her prices, didn't she lose sales to cheaper competitors?"

Yes — she did see a dip in volume initially. But two things protected her. First, Sandra had registered under Amazon Brand Registry, which meant other sellers couldn't easily undercut her price on her own listings. She had more control over her buy box than most sellers realise is possible.

Second — and more importantly — the math changed in her favour regardless. It is better to sell 100 units at $7 profit than 130 units at $2. Fewer orders at higher margin meant more cash in the bank, not less. Her gross profit per order increased significantly while fulfillment costs remained flat. She made more money on lower volume — and the bundles pushed her unit volume back up anyway as customers bought in larger quantities.

The customers who left were bargain-hunters. The customers who stayed were buying for quality. That is a customer base worth building.

Why This Works Beyond the Numbers

Fixed costs shrink per unit

Fulfillment, storage, customer support — when these costs don't grow linearly with units, bundling compresses them across more revenue per order. The same $4.25 fulfillment cost on a $65 order is 6.5% of revenue. On a $12.99 order it was 30.8%. That difference is pure margin.

Higher AOV unlocks better ad performance

With a higher average order value, Sandra could afford to bid more on ads without sacrificing margin. A campaign that was break-even at $12.99 per unit became profitable at $65 per order — with no change to the creative, the targeting, or the spend level. Better ROAS from the same budget.

Bundles shorten the cash conversion cycle

More units sold per order means faster inventory turnover and more cash freed up for the next purchase order. In Sandra's case, the higher gross profit per order meant her inventory didn't need to churn as fast to generate the capital needed to reorder. More margin equals less cash risk — and a shorter window between paying the supplier and getting the money back through sales.

The Anchor Pricing Principle

Key Principle

Never discount the single unit to drive volume. Keep it at full price so the bundle becomes the obvious choice. The anchor is what makes the bundle feel like a deal — without a credible single-unit price, the discount has nothing to contrast against and the mechanic breaks down.

Common Mistakes to Avoid

Bundling Pitfalls
  • Over-discounting the bundle. A 5-pack should not be 40% off the single-unit price. Just enough discount to make it feel smarter than buying five singles — not so much that you erase the margin you just built.
  • Ignoring packaging dimensions. Larger bundles may need new box sizes or inserts. Include that in your COGS calculation before you launch, not after you see the fulfillment bill.
  • Not checking marketplace rules. Platforms like Amazon determine pick and pack fees by volume and weight. A 20-pack will not have the same fee as a 5-pack. Do the math before you build the listing.
  • Tracking GP per unit instead of per bundle. Each bundle SKU needs its own COGS line in your books. Blending them into a single product line hides the real margin on each configuration.
  • Launching bundles without a modeled floor. Always establish your minimum gross profit per order before discounting. If the bundle takes you below that floor, it does not get launched.

What Saved Sandra

It wasn't a viral moment. It wasn't a new product launch. It wasn't a better agency. What saved Sandra was better math — clean unit economics, smarter bundling, and pricing built on true cost data rather than competitive guessing.

If you are only selling single units, you are almost certainly leaving money on the table. The fulfillment cost you are paying on every single-unit order could be funding margin on a bundle. The customers who would buy a 3-pack or a 5-pack are already in your store — they just have no reason to yet.

Bundles do not just help your customers save. They help you earn more, per shipment, with less effort.

The CronosNow ecommerce accountant Takeaway

What saved Sandra wasn’t a flashy campaign or viral moment—it was better math. Clean unit economics, smarter bundling, and pricing built on true cost data.

If you’re only selling single units, you’re likely leaving money on the table. Bundles don’t just help your customers save—they help you earn more, per shipment, with less effort.

Need help modeling your bundles and gross profit? That’s what we do.

CRONOSNOW | CPG & ECOMMERCE ACCOUNTANTS
Gain Clarity. See the Path Ahead.