Why selling dead stock at 50% off beats holding it at 0% off (and how to count all three hidden costs)

Why selling dead stock at 50% off beats holding it at 0% off (and how to count all three hidden costs)

Best viewed on desktop This article is built around full-width charts and data tables. On mobile they may appear truncated. For the complete picture, open this page on a desktop or tablet in landscape mode.

The Problem with Treating Dead Stock Like It Will Sell Eventually

When founders look at dead stock — inventory that has not moved in 90 days or more — the instinct is to wait it out. The product cost was paid months ago; surely it will sell at the right time, the right season, the right campaign. The brand holds, and holds, and holds.

The trouble is that dead stock is not really inventory in the way founders think about it. The original cost has been spent, the goods are sitting in a warehouse you are paying to use, and every additional month of waiting widens the gap between what you could have recovered and what you actually will.

A correctly-priced clearance, designed properly, recognises three things about dead stock that the wait-it-out approach ignores:

  • Dead stock costs you money every month: Inventory sitting at the Third-Party Logistics (3PL) facility accrues storage fees of $0.30 to $0.60 per unit per month. On top of that, the capital tied up in non-moving inventory cannot be redeployed on faster-moving items — it is a real opportunity cost. Both costs grow the longer you hold.
  • Dead stock gets harder to clear over time: Seasonal items go further out of season. Last-year colourways date. Trends move on. The discount required to move the inventory grows every quarter. Many brands end up writing off entirely what could have been recovered at clearance prices six months earlier.
  • The original Cost of Goods Sold (COGS) is sunk and does not matter for the decision: What matters is INCREMENTAL contribution — the revenue you get from selling, minus the per-order costs you would have to pay today to make the sale happen. The original COGS has already left your bank account. At the incremental-contribution lens, a 50 percent discount that looks brutal on paper recovers far more than holding does — and infinitely more than writing the inventory off.

The math runs on the same six profit levers as any other campaign:

The Six Profit Levers in Ecommerce
  1. Product cost What you paid to have it made and shipped into your warehouse.
  2. Discounts Often used to convince strangers to buy from you because you do not have a big brand yet.
  3. Returns Not only the money the customer gets back, but also the cost of getting the item back into your warehouse and re-stocked.
  4. Warehousing and outbound shipping to the customer 3PL storage allocation, pick, pack, and the courier cost to the customer’s door.
  5. Ad spend to drive traffic to the online store Google Ads, Meta, and the rest of your paid channels.
  6. Payment processor and channel fees Combined at the platform’s rate — approximately 3% on Shopify and similar direct ecommerce, 15% on Amazon, Walmart and other marketplaces.

On dead stock, the Product cost lever is already sunk — the money has been spent and cannot be recovered. The remaining five levers still apply on every clearance sale, but they now apply to revenue you would otherwise never see. This article will show you how to price the inventory so the remaining recovery is as large as possible.

1. Example showing you the numbers

Imagine you sell premium coffee accessories on Shopify — sauté pans, drinkware, and mugs. Eight months ago you launched a matte-black coffee carafe with handcrafted wooden handles at $80 retail. The carafe photographed beautifully and your supplier required a 300-unit Minimum Order Quantity (MOQ). Eight months in, 100 units have sold; 200 units remain at the 3PL accruing holding fees. The per-month sales rate has dropped to single digits. The remaining inventory is dead. The story walks through two paths for those 200 units: hold them and hope, or clear them now at a meaningful discount.

You leave the 200 dead carafes in the 3PL warehouse and hope demand returns. For 12 months you pay $0.50 per unit per month in storage fees — $1,200 of holding cost burned with nothing to show for it.

At month 12 you accept reality and clear the remaining inventory at 50% off ($40 paid). Per unit you recover $27 of incremental contribution from the sale, then deduct $6 of accumulated holding cost — leaving $21 of net contribution per unit.

Across 200 units the total recovery is $4,200. The hold-and-hope decision cost you $1,200 in delayed recovery versus clearing at 50% off today, even before counting the opportunity cost of the capital that sat locked for a year.

Per-unit math after holding 12 months

Sold at 50% off after a year of waiting. Original COGS treated as sunk.

Selling price (50% off retail)+$40
Ad spend (per order)−$5
3PL pick and pack−$5
Returns−$2
Payment processor and channel fees (≈3%)−$1
Accumulated holding cost (12 × $0.50)−$6
Hold-then-clear contribution$21

You drop the price to $40 (50% off the $80 retail) for a fixed 30-day clearance window. The deeper discount plus the urgency framing drives the inventory to sell through within the window.

Per unit you recover $27 of incremental contribution — the $40 selling price minus the per-order costs ($5 ad, $5 3PL, $2 returns, $1 payment). The original COGS is sunk; this is the recovery on top of what was already spent.

Across 200 units the recovery is $5,400 — $1,200 more than the hold-and-clear option. The capital that was locked is freed, the holding cost is stopped, and the brand can redeploy the working capital onto faster-moving SKUs.

Per-unit math at immediate clearance

30-day window at 50% off. No accumulated holding cost.

Selling price (50% off retail)+$40
Ad spend (per order)−$5
3PL pick and pack−$5
Returns−$2
Payment processor and channel fees (≈3%)−$1
No holding cost accumulated$0
Clear-now contribution$27

The Dead Stock Model

Five scenarios side by side. The first is Business as usual (BAU) at the standing 10% sitewide discount — what would have happened if the inventory had moved on time. The next four are dead-stock options: clear at three progressively deeper discounts, hold 12 months and clear, or write off entirely.

Per-unit incremental contribution across BAU and four dead-stock options

Incremental contribution treats the original $28 of COGS as sunk and not recoverable. The only costs that matter are the per-order costs you would have to pay TODAY to make the sale happen, plus any accumulated holding cost.

Line Item BAU full retail (10% sitewide) Clear at 30% off Clear at 50% off Hold 12 months then clear at 50% Write off
Selling price$72$56$40$40$0
Original COGS (sunk on all scenarios)$28$28$28$28$28
Ad spend (per order)−$5−$5−$5−$5$0
3PL pick and pack−$5−$5−$5−$5$0
Returns−$2−$2−$2−$2$0
Payment processor and channel fees (≈3%)−$2−$2−$1−$1$0
Accumulated holding cost (12 × $0.50)$0$0$0−$6−$3
Incremental contribution per unit+$58+$42+$27+$21−$3
Across 200 dead unitsn/a$8,400$5,400$4,200−$600
Strategic reframe

The original cost of dead stock is sunk and irrelevant. The only number that matters is incremental contribution — and any positive incremental contribution beats holding, which beats writing off.

Clearing at 50% off today recovers $27 per unit. Waiting twelve months and clearing at the same price recovers only $21 per unit, because accumulated holding cost has eaten the difference. Writing off recovers nothing AND burns whatever holding cost was paid before the decision. The discipline is to decide on the clearance early, price it for fastest sell-through, and free the capital to redeploy on faster-moving SKUs.

Incremental contribution per unit across the five scenarios

The BAU bar is the contribution that would have been earned if the carafe had sold on time. The two clearance bars (green) recover positive contribution. The hold-then-clear bar (amber) is eaten by accumulated holding cost. The write-off bar is the only negative result — recovering nothing AND burning whatever was held before the decision.

2. How to price dead stock for fastest clearance

Dead stock is not so much a discounting problem as it is a capital allocation problem. Every month of holding is a month the locked capital could have been earning contribution on faster-moving inventory. The right discount is the one that clears the inventory fastest while recovering positive incremental contribution.

Six steps to clear dead stock without losing more than you have to.

  1. Identify dead stock with a hard trigger. Inventory that has not moved in 90 days, or that has more than 12 months of supply at current sales rate, is dead. The trigger should be mechanical, not judgement-based. Set up the 3PL or inventory system to flag dead-stock SKUs automatically each month.
  2. Calculate the holding cost honestly. Add the 3PL storage fee (typically $0.30 to $0.60 per unit per month) to the opportunity cost of the locked capital. If your working capital is funding a 10 percent annual return on faster-moving inventory, holding $28 of original COGS per unit for 12 months represents another $2.80 of foregone earnings per unit on top of the storage fee. The full holding cost is meaningfully higher than the 3PL invoice shows.
  3. Calculate incremental contribution at each discount tier. Strip out COGS — it is sunk. What remains is selling price minus the per-order operating costs that would apply today. Any positive number is a recovery; any negative number is a loss to avoid.
  4. Set the clearance discount at the tier that maximises BOTH speed AND incremental contribution. Deeper discounts move inventory faster but earn less per unit. There is a sweet spot — typically between 40 and 60 percent off — where the units clear in 30 days at a positive incremental contribution. Below 40 percent off the units tend not to move fast enough; below 30 percent of recovery they may not clear at all and you accumulate more holding cost.
  5. Enforce a strict 30-day clearance deadline. Open-ended sales drag out, but hard closing dates trigger consumer urgency. After the deadline, take the remaining inventory off the website and route it to a donation partner, a third-party clearance buyer, or a write-off — and remove the SKU from the catalogue entirely.
  6. Build a no-dead-stock SKU launch process. The cheapest way to handle dead stock is to never accumulate it. Use launch templates that require pre-launch demand modelling, conservative initial production runs, and an option to reorder rather than over-order on day one. The carafe in this article would not have become dead stock if the initial run had been 100 units with a reorder trigger at 50 sold, instead of 300 units shipped in on day one.

3. Frequently asked questions

How do I know if I have dead stock?

Run a report against your inventory: any SKU with zero sales in the last 90 days, or any SKU with more than 12 months of inventory at current sales rate. Both are dead-stock triggers. Most ecommerce inventory systems can run this report directly; if yours cannot, the 3PL usually can. Flag the dead SKUs monthly and review them for clearance, donation, or write-off.

Will running clearance sales train customers to wait for them?

Only if you run them regularly and predictably. Make clearance sales unusual — once a quarter at most, and always positioned as a specific event (end of season, brand refresh, last-chance run) rather than a recurring price drop. Customers do not learn to wait for irregular events tied to specific inventory situations.

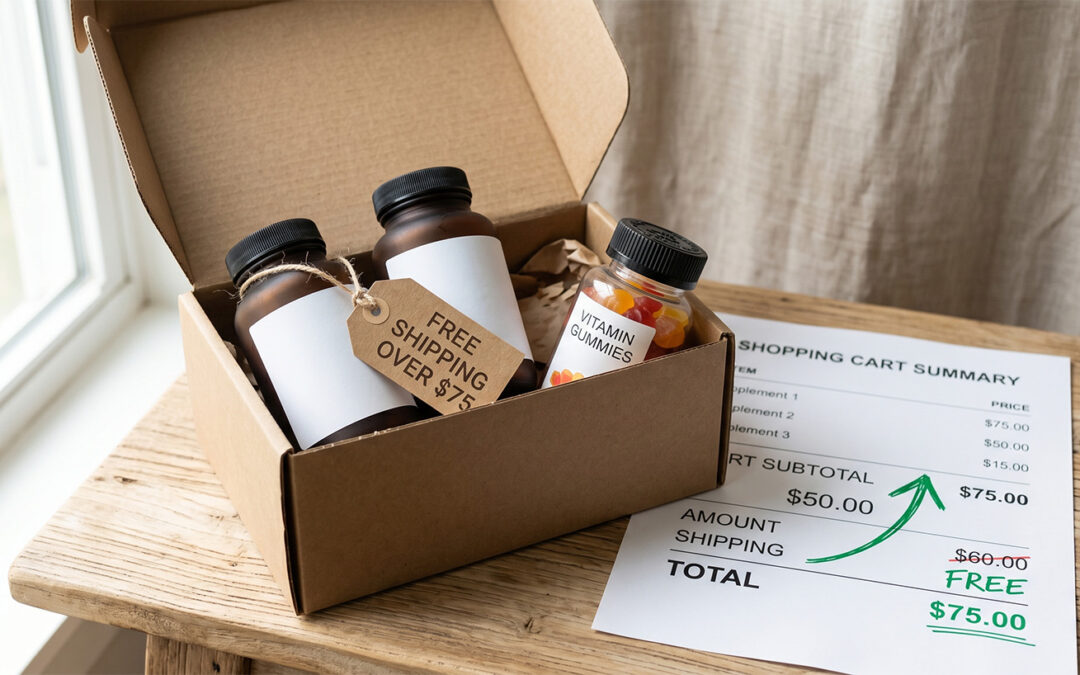
Can I bundle dead stock with regular SKUs to clear it?

Yes, and this can work well. Bundle a dead-stock item as a free gift with the purchase of a current-season hero product, or use it as the qualifying gift in a Gift with Purchase (GWP) campaign with a threshold above current Average Order Value (AOV). The dead stock clears, the customer perceives a generous offer, and the hero product earns its full margin. The carafe in this article could be bundled as a free gift with the purchase of a $60-plus drinkware set.

What about Amazon — can I clear dead stock through Amazon FBA?

Yes, and this is one of the best uses of Amazon for direct ecommerce brands. Amazon’s audience is broader, more discount-driven, and more willing to buy last-season inventory than your direct ecommerce audience. Push dead stock to Amazon at deep discounts to clear without eroding your direct brand pricing. Account for the Fulfilled by Amazon (FBA) fees in your incremental contribution math — they typically take an additional 15 percent off the selling price.

What about the tax treatment of write-offs?

Inventory write-offs are typically deductible against the year’s taxable income, but the rules vary by jurisdiction. Donations to qualifying charities can sometimes be deducted at the inventory’s basis plus a portion of the fair market value. Talk to your accountant before writing off — the tax position is often better than founders assume, but only with proper documentation.

How do I prevent dead stock in the first place?

Conservative initial production runs are the single highest-leverage move. Most brands over-order on new SKU launches because the per-unit cost falls at higher volumes. The hidden cost is the dead stock that accumulates when demand falls short of the order. A smaller initial run at a slightly higher per-unit cost beats a larger run that ends up partially written off. Set a hard MOQ trigger above which you cannot place an order without sign-off from someone tracking dead-stock metrics.

4. Quick reference: what to avoid and what to apply

What to Avoid
  • Anchoring the clearance decision on the original COGS — the money is already spent and cannot be recovered.
  • Holding dead stock indefinitely while you wait for demand to return — holding cost compounds every month and eats the recovery.
  • Writing off without trying a clearance sale first — any positive incremental contribution beats $0.
  • Open-ended clearance sales — hard 30-day deadlines drive urgency; open windows drift.
  • Running clearance sales regularly and predictably — customers learn to wait for them and your hero prices look like a bad deal.
  • Over-ordering on new SKU launches because the per-unit cost falls at volume — the hidden cost is the dead stock that builds when demand falls short.
  • Ignoring the opportunity cost of locked capital — it is real, even though it does not appear on the 3PL invoice.
What You Should Do
  • Flag dead-stock SKUs automatically each month with hard triggers (90-day no-sale, or 12+ months of supply).
  • Strip out the original COGS when modelling clearance — it is sunk.
  • Set the clearance discount at the tier that maximises both speed AND incremental contribution.
  • Enforce a strict 30-day clearance window with a hard deadline.
  • Route post-deadline inventory to a donation partner, third-party clearance buyer, or write-off.
  • Build conservative initial production runs into your SKU launch process.
  • Push dead stock to Amazon FBA for broader, discount-driven audiences when your direct channel cannot clear it.
Definitions, modelling notes, and rate-basis disclosures Click to expand — benchmarks and assumptions used in the worked example above.
Definitions
  • Selling Price in this article is held at $80 per single unit (the matte-black coffee carafe) at full retail. The scenarios modelled are full retail with the standing 10% sitewide discount ($72 paid), and clearance discounts of 30% off ($56), 50% off ($40), and 70% off ($24). The brand’s hero range is coffee accessories — sauté pans, drinkware, and mugs; the carafe was a 2024 launch that did not clear.
  • The six profit levers in this framework: (1) Product (COGS), (2) 3PL and outbound shipping, (3) Ad spend, (4) Returns, (5) Discounts, (6) Payment processor and channel fees (combined).
  • Business as usual (BAU) in this article is the standing 10% sitewide discount applied to current-season inventory that is selling at expected velocity. The BAU column in the master table shows what the carafe would have earned if it had cleared at the original launch pace.
  • Dead stock is inventory that has not sold in 90 days, or for which there is more than 12 months of supply at the current sales rate. Both triggers are mechanical and should be set up to flag SKUs automatically.
  • Cost of Goods Sold (COGS) is the landed product cost per unit — manufacturing plus inbound freight plus customs duty. Held at $28 for the carafe in this teaching model (35% COGS at $80 retail, typical of handcrafted premium kitchenware).
  • Incremental Contribution is revenue minus the per-order operating costs (ad spend, 3PL, returns, payment processor), with the original COGS treated as sunk and not recoverable. This is the correct lens for any dead-stock decision.
  • Holding cost is the recurring monthly fee charged by the 3PL for storing inventory, plus the opportunity cost of capital tied up in non-moving inventory. In this teaching model the explicit 3PL holding fee is $0.50 per unit per month.
  • Third-Party Logistics (3PL) is the outsourced warehousing and fulfilment provider. Storage fees, pick-and-pack labour, and outbound shipping are all included.
  • Stock Keeping Unit (SKU) is a single distinct product line in the brand’s catalogue. The carafe is one SKU in the brand’s coffee accessories range.
  • Minimum Order Quantity (MOQ) is the smallest order size a supplier will accept. MOQs are one of the largest contributors to dead stock because they force brands to commit to larger production runs than demand may support.
  • Write-off is the disposal of inventory without recovery, treated as a tax-deductible loss against the year’s income. The recovery is zero; the holding cost already paid is irrecoverable.
Modelling notes
  • All dead-stock contribution figures in this article are stated as INCREMENTAL contribution — the original COGS is treated as sunk. This is the correct lens for any decision about already-purchased inventory.
  • The BAU full-priced column ($58 incremental contribution) shows what the carafe would have earned per unit had it sold on time at full retail with the 10% sitewide discount. The dead-stock scenarios are the alternatives that became relevant once the inventory failed to clear.
  • The holding cost is set at $0.50 per unit per month. Actual 3PL storage fees vary by warehouse, item dimensions, and storage type. A coffee carafe with ceramic body and wooden handles takes up modest shelf space.
  • The opportunity cost of locked capital is not included in the master table for clarity, but is real and meaningful. If your business could earn 10% annually on capital deployed on fast-moving inventory, holding $28 of original COGS per unit for 12 months represents another $2.80 of foregone earnings per unit on top of the storage fee.
  • The premium coffee carafe profile used here has 35% COGS at full retail. Different categories use different ratios; commodity drinkware and mass-market mugs may run at 20-25% COGS, while small-batch artisan items may run higher.
Rate-basis disclosures
  • Product (carafe COGS): $28 per unit at $80 retail (35% COGS). Treated as sunk on all dead-stock scenarios.
  • Ad spend: $5 per order, held flat across all scenarios.
  • 3PL pick and pack: $5 per order, reflecting the carafe’s heavier weight and fragile-item packaging requirements.
  • Returns: $2 per order. Premium coffee accessories have a moderately higher return rate than commodity drinkware because of fit-to-decor expectations.
  • Payment processor and channel fees: approximately 3% of revenue on Shopify (2.9% plus 30 cents per transaction). Rounded to the nearest dollar.
  • Holding cost: $0.50 per unit per month at the 3PL. Add opportunity cost on locked capital for the complete picture.

CronosNow: Numbers you can trust. Info you can use. Insights you can action.

Why subscription discounts pay back in lifetime value (and how to set the trade right)

Why subscription discounts pay back in lifetime value (and how to set the trade right)

Best viewed on desktop This article is built around full-width charts and data tables. On mobile they may appear truncated. For the complete picture, open this page on a desktop or tablet in landscape mode.

The Problem with Looking at Subscriptions on a Per-Order Basis

Many founders reject subscription models because a 10 to 20 percent discount slashes their immediate margins. But evaluating a subscription on a single order is a mistake.

The per-order math is the wrong frame. The right frame is the twelve-month net contribution per customer you will earn. With a subscription, profit is calculated over the lifetime of the customer, not just at initial purchase.

A subscription discount, designed correctly, builds lifetime contribution in three layers:

  • Order 1 is thin — and may be a small loss: The Customer Acquisition Cost (CAC) plus the subscription discount squeezes order 1 to near zero. In this article’s worked example, order 1 lands at $1 of contribution. With slightly deeper discount or higher CAC, order 1 flips to a small loss. That is fine — the recurring orders cover it inside one month.
  • Orders 2 through 12 each earn double the standalone contribution: From order 2 onwards, no new CAC hits the order. Each recurring delivery earns $26 of contribution. The same customer on a single standalone sale earns the brand $12. The recurring relationship is more profitable per order than the one-time sale, even with the subscription discount in place.
  • Twelve months of recurring orders dwarf the standalone alternative: Across twelve monthly orders the subscriber generates $287 of cumulative contribution — twenty-four times the standalone customer’s $12. Even with realistic churn at month 6, the subscriber still banks $131 — eleven times the standalone. The thin order 1 is the price of admission to a customer relationship worth far more than the single sale.

The math runs on the same six profit levers as any other campaign:

The Six Profit Levers in Ecommerce
  1. Product cost What you paid to have it made and shipped into your warehouse.
  2. Discounts Often used to convince strangers to buy from you because you do not have a big brand yet.
  3. Returns Not only the money the customer gets back, but also the cost of getting the item back into your warehouse and re-stocked.
  4. Warehousing and outbound shipping to the customer 3PL storage allocation, pick, pack, and the courier cost to the customer’s door.
  5. Ad spend to drive traffic to the online store Google Ads, Meta, and the rest of your paid channels.
  6. Payment processor and channel fees Combined at the platform’s rate — approximately 3% on Shopify and similar direct ecommerce, 15% on Amazon, Walmart and other marketplaces.

Four levers stay flat between a standalone single-sale and a subscriber’s recurring order. Product cost, 3PL, payment processor and returns are essentially identical per order. The Ad spend lever is the one that changes — paid once to acquire the customer, then zero for every recurring order that follows. This article will show you how to price subscribe-and-save so the twelve-month LTV comfortably exceeds the standalone single-sale.

1. Example showing you the numbers

Imagine you sell premium multivitamins on Shopify. Your hero product is a 30-day bottle you retail at $60 per unit. Your standalone customer pays the full $60. Your subscribe-and-save offer gives subscribers 20% off, so they pay $48 per bottle every month. The story walks through two acquisition paths: a standalone customer who buys once, and a subscriber whose recurring orders capture twelve months of contribution.

A customer clicks an ad, picks up a bottle at full retail $60, pays, and leaves.

The math on a single sale is straightforward. Your $60 retail price covers product, shipping, and upfront ad spend, leaving a clean $12 profit.

It is sustainable, but it leaves long-term value on the table — there is no recurring relationship.

Per-customer math at standalone single-buy

One bottle. Full retail. Full acquisition cost.

Selling price (full retail)+$60
Product cost−$15
Ad spend (acquisition)−$25
3PL and outbound shipping−$5
Payment processor and channel fees (≈3%)−$2
Baseline returns−$1
Standalone customer LTV$12

The same ad-click customer chooses Subscribe & Save: $48 per bottle, 20% off retail, monthly delivery.

Order 1 lands at $1 of contribution after the $25 CAC. Orders 2 through 12 each earn $26 because the CAC was paid once.

Across the year the subscriber generates $287 of cumulative contribution — twenty-four times the standalone customer’s $12.

Per-customer math at subscribe-and-save

12 monthly orders. Ad spend paid once. Recurring contribution at $26 per order.

Order 1 selling price (20% off $60)+$48
Order 1 contribution (carries $25 CAC)+$1
Orders 2-12 contribution per order (no CAC)+$26
Orders 2-12 cumulative (11 × $26)+$286
Total 12-month subscriber LTV+$287
Subscriber 12-month LTV$287

The Subscriber Model

Five scenarios side by side. The first is the standalone single-buy customer at full retail. The next three break down the subscriber’s economics at order 1 (carries acquisition cost), orders 2-12 (per recurring order), and the 12-month cumulative LTV. The last is a realistic churn case where the subscriber cancels at month 6.

Per-customer and per-order economics across standalone and subscriber scenarios

Values stated as totals per order for the per-order rows, and cumulative across the lifetime for the LTV rows. The 12-month subscriber column assumes no churn for teaching clarity; the 6-month churn column shows what happens if the subscriber cancels after six orders.

Line Item Standalone single-buy (full retail) Subscriber order 1 Subscriber order 2+ (each) Subscriber 12-month LTV (no churn) Subscriber 6-month LTV (50% churn)
Orders per customer111 (recurring)126
Customer pays per order$60$48$48$48 each$48 each
Product (COGS)$15$15$15$180$90
Ad spend (acquisition only)$25$25$0$25$25
3PL and outbound shipping$5$5$5$60$30
Payment processor and channel fees (≈3%)$2$1$1$12$6
Baseline returns$1$1$1$12$6
Total brand cost$48$47$22$289$157
Brand contribution+$12+$1+$26+$287+$131
Strategic reframe

Think of the first order’s discount as a marketing cost to lock in eleven more months of high-margin revenue. Future orders fund the initial discount.

Each recurring order earns more than double a standalone single-sale, because the acquisition cost was paid once and never paid again. Optimise on twelve-month LTV by cohort — not on order-1 contribution.

Cumulative contribution per customer across twelve months

The standalone customer banks $12 once and stops. The subscriber starts at $1 in month 1 and climbs by $26 each month. The two lines cross during month 2 — and by month 12 the subscriber is 24 times higher than the standalone.

2. How to price a profitable subscription

A subscription discount is a deal between the brand and the customer. The customer agrees to a recurring relationship in exchange for a meaningful per-order saving. The brand agrees to a thin order 1 in exchange for eleven more orders of full-margin contribution.

Six steps to price a subscription that pays for itself.

  1. Sell the standalone product at full retail. No sitewide discount, no bundle pricing on the single unit. The standalone customer pays the full price — and the brand earns a clean per-customer contribution on that sale. The full-retail price is also the anchor that gives the subscription discount its perceived value. If standalone customers already get a discount, the subscription saving is smaller in contrast and feels less compelling.
  2. Set subscribe-and-save at 10 to 20 percent off full retail. Too shallow and few customers enrol; too deep and order 1 may lose more money than the recurring orders comfortably recover. The 20 percent off example in this article keeps order 1 just above zero. If you want a deeper discount, raise the retail or accept a small order 1 loss that the recurring orders recover within one cycle.
  3. Verify the cumulative break-even by month 2 or 3. With order 1 at or near zero and orders 2-12 each earning full margin, the cumulative contribution should cross into positive territory within the first two recurring orders. If the breakeven extends past month 4, the discount is too deep, the retail is too low, or your CAC is too high. Model this before launch.
  4. Make subscription the default at checkout. The customer has to actively unselect subscribe-and-save to choose one-time. Defaults move conversion dramatically — well-designed flows convert 30 to 50 percent of customers into subscribers when the subscription is the default option.
  5. Track subscriber retention by acquisition cohort. The metric that matters is what percentage of customers acquired in a given month are still subscribed at three, six, and twelve months. Churn between months 1 and 3 is usually the steepest part of the curve — if more than 40 percent of subscribers cancel before order 3, the product or the onboarding experience needs work.
  6. Reactivate churned subscribers with a one-month return offer. A subscriber who churned at month 4 is not the same as a brand-new customer — they have already validated the product. A targeted “come back for one month at $40” offer often re-activates the subscription cleanly. The CAC has already been paid, so the return offer can be aggressive without breaking the unit economics.

3. Frequently asked questions

Why does the standalone product not get the 10 percent sitewide discount?

Because the subscription discount depends on a contrast against full retail. If the standalone customer already gets 10 percent off ($54), then a subscription at 20 percent off ($48) is only a $6 saving compared to standalone — and the contrast is weak. By holding standalone at full retail $60 and reserving the discount exclusively for subscribers, the saving climbs to $12 per bottle ($144 across the year), which is meaningful enough to drive enrolment. The discount is most valuable when it is reserved for the customers committing to a recurring relationship.

What if my product is not naturally consumable?

Subscription works best on consumables — things customers use up and need to buy again. Vitamins, coffee, pet food, protein powder, household consumables, skincare, haircare. The mechanic only works when the customer has a natural reason to buy the same product every month. You would not run a subscription on wooden spoons because customers do not need a new set every month. For non-consumables, a curated discovery box can still work — a fashion brand offering a quarterly apparel drop, a coffee brand offering a different single-origin every month — but the mechanic shifts from replenishment to discovery.

How deep should the subscription discount be?

Run the math two ways before you commit. At 10 percent off, you preserve more order 1 margin but enrolment will be lower. At 20 percent off, enrolment is stronger but order 1 sits at or near zero. The optimal point maximises total programme contribution across all acquired subscribers, not per-subscriber LTV in isolation. Most categories find the sweet spot between 15 and 20 percent off.

What if subscribers churn after just one or two orders?

An early-churn subscriber is thinner than a standalone customer because the subscription discount means order 1 earns less than a full-retail sale. If more than 40 percent of your subscribers cancel before order 3, the programme may be destroying value relative to selling standalone. Look at three things: the onboarding experience (do subscribers know what to expect), the product (does the customer actually want it monthly), and the cancellation flow (are customers cancelling because of friction with the subscription mechanic, not the product itself). Fix these before scaling enrolment.

Can I offer different discount tiers for annual versus monthly?

Yes. Annual prepay at a deeper discount (20 to 25 percent off) is a powerful upgrade for subscribers who have stuck through three or four monthly orders. The annual customer has effectively prepaid the lifetime value upfront, eliminating churn risk for the duration. Offer the annual upgrade once the monthly subscriber has demonstrated commitment — the conversion rate on a sixth-month annual upgrade offer is typically much higher than on a first-month offer.

How does subscription compare to bundles and GWP campaigns?

All three boost revenue, but they pull different financial levers. Bundles discount a fixed group of items to spread per-order fixed costs across multiple units in one shipment. A Gift with Purchase (GWP) keeps headline prices flat and uses the gift’s wholesale-to-retail markup at a qualifying threshold to pull an incremental cart item. A subscription discounts a recurring relationship to spread acquisition cost across the customer’s lifetime. Bundles and GWP boost a single order; subscriptions boost the customer relationship. They coexist cleanly: a subscriber can still receive a GWP campaign on order 8, layering AOV lift on top of LTV.

What about Amazon Subscribe and Save?

Amazon’s Subscribe and Save costs the brand 5 to 10 percent on top of the standard Fulfilled by Amazon (FBA) fees and lifts customer perceived value through Amazon’s branded badge. The economics are similar to direct subscription with a roughly 5 percent fee drag. The main caveat is that you do not own the customer relationship — Amazon controls the data, the renewal cadence, and the cancellation flow. For brands building toward direct-customer LTV, native Shopify subscription is the stronger play even though Amazon Subscribe and Save can drive incremental volume.

4. Quick reference: what to avoid and what to apply

What to Avoid
  • Evaluating a subscription programme on order 1 contribution alone — the recurring orders are where the value lives.
  • Discounting the standalone product — it erodes the contrast that makes the subscription saving feel meaningful.
  • Setting subscribe-and-save too shallow (under 10 percent) — few customers enrol and the programme does not scale.
  • Setting subscribe-and-save too deep (over 25 percent) — the cumulative breakeven extends past month 3 and the LTV math thins.
  • Hiding the subscription option behind a click — defaults move conversion dramatically.
  • Ignoring first-90-day cohort retention — this is where the biggest churn happens and the biggest leverage on programme economics lives.
  • Treating a churned subscriber as a brand-new customer — they have already validated the product and should be reactivated specifically.
What You Should Do
  • Sell the standalone product at full retail. No sitewide on the single unit.
  • Set subscribe-and-save at 10 to 20 percent off retail.
  • Verify cumulative breakeven by month 2 or 3 before launch.
  • Make subscription the default at checkout.
  • Track cohort retention at 3, 6, and 12 months — watch early-churn especially.
  • Reduce first-90-day churn with onboarding emails, shipping flexibility, and proactive customer service.
  • Reactivate churned subscribers with a targeted one-month return offer.
Definitions, modelling notes, and rate-basis disclosures Click to expand — benchmarks and assumptions used in the worked example above.
Definitions
  • Standalone retail in this article is held at $60 per single unit (the multivitamin bottle) at full retail with NO sitewide discount. The standalone customer pays the full $60. The subscriber pays the subscribe-and-save price of $48 per bottle (20% off full retail). The article deliberately drops the standing 10% sitewide because the subscription’s perceived value depends on contrasting against full retail.
  • The six profit levers in this framework: (1) Product (COGS), (2) 3PL and outbound shipping, (3) Ad spend, (4) Returns, (5) Discounts, (6) Payment processor and channel fees (combined).
  • Customer Lifetime Value (LTV) is the cumulative brand contribution from a customer across the entire customer relationship. For standalone single-buy customers, LTV is the single-order contribution. For subscribers, LTV is the cumulative contribution across the full subscription life (or the period before churn).
  • Customer Acquisition Cost (CAC) is the ad spend required to win one new customer. Held at $25 per acquired customer in this teaching model, representative of premium D2C wellness. The cost is paid once on the first order. Across a 12-order subscriber, the per-order effective CAC drops to about $2.
  • Cost of Goods Sold (COGS) is the landed product cost per unit — manufacturing plus inbound freight plus customs duty. Held at $15 for the multivitamin bottle in this teaching model (25% COGS at $60 retail, typical of premium D2C wellness).
  • Third-Party Logistics (3PL) is the outsourced warehousing and fulfilment provider. Charges include pick-and-pack labour per order plus storage allocation per month per SKU plus outbound courier shipping. Held at $5 combined per order in this model.
  • Stock Keeping Unit (SKU) is a single distinct product line in the brand’s catalogue.
  • Churn is the rate at which subscribers cancel. The teaching example assumes either no churn (12-month LTV column) or 50 percent churn at month 6 (6-month LTV column). In production, brands should model expected churn cohort by cohort.
  • Cumulative breakeven is the point at which a subscriber’s cumulative contribution returns to zero after the order-1 hit. In this model the crossover happens during month 2 because each recurring order ($26) is significantly larger than the order-1 contribution ($1).
  • Contribution per Order is Sell Price minus all six lever costs. For subscribers, contribution per order from order 2 onwards is much higher than a standalone single-buy because the ad spend lever is zero.
Modelling notes
  • This article drops the standing 10% sitewide discount on the standalone single-buy customer that appears in other Playbook articles. The reason: the subscription’s perceived value depends on contrasting against full retail. A sitewide discount on standalone narrows that contrast and weakens the enrolment driver. Other articles in the Playbook that compare a single campaign mechanic against the BAU baseline still apply the sitewide; this article uses full retail deliberately.
  • Customer Acquisition Cost is held at $25 — representative of premium D2C wellness brands where paid social and search CPMs have driven CACs into the $20 to $50+ range. Your category may run cheaper or more expensive; plug in your blended CAC from trailing 90 days of paid acquisition data.
  • The 12-month subscriber LTV is calculated assuming no churn — a simplification for teaching clarity. The 6-month LTV column shows a realistic 50% churn case where the subscriber leaves after six orders. In production, brands should multiply order counts by realistic cohort retention rates from their own data.
  • Ad spend is held at $25 on order 1 and $0 on orders 2 through 12. This represents the cleanest pedagogical case; some retargeting and lifecycle marketing spend may still apply but is typically small relative to acquisition cost and is treated as fixed overhead in this model.
  • The premium multivitamin profile used here has 25% COGS and 75% Gross Profit at full retail — typical of premium D2C wellness. Different categories use different ratios.
  • Subscriber order economics assume the same 3PL, payment processor, and returns rates as standalone orders. In practice, subscriber return rates are typically modestly lower because the customer has actively chosen the product and the recurring relationship.
Rate-basis disclosures
  • Product (multivitamin COGS): $15 per unit at $60 retail (25% COGS, premium D2C wellness typical). Held fixed per unit and scales linearly with order count.
  • Ad spend / CAC: $25 per acquired customer. Held flat across standalone and subscription acquisition. Subsequent subscription orders carry no ad spend. Use your blended trailing-90-day CAC from your own paid channels if it differs.
  • 3PL and outbound shipping: $5 per order combined — reflecting realistic 3PL pick-and-pack labour plus outbound postage. Held flat across standalone and subscription orders.
  • Payment processor and channel fees: approximately 3% of revenue on Shopify (2.9% plus 30 cents per transaction). Rounded to nearest dollar across scenarios for teaching clarity ($2 on the $60 standalone, $1 on the $48 subscription).
  • Baseline returns: $1 per order in this teaching model. Subscription orders typically see slightly lower return rates in production — model accordingly if your category shows that pattern.

CronosNow: Numbers you can trust. Info you can use. Insights you can action.

Why a gift with purchase converts better than a discount (and how to use it to clear slow-moving stock)

Why a gift with purchase converts better than a discount (and how to use it to clear slow-moving stock)

Best viewed on desktop This article is built around full-width charts and data tables. On mobile they may appear truncated. For the complete picture, open this page on a desktop or tablet in landscape mode.

The Problem with Treating Every Promotion as a Discount

When founders want to drive a campaign, they reach for the same lever every time: a percentage discount. Take 10% off, take 20% off, take 30% off. The customer pays less, the brand earns less, everyone moves on.

The trouble is that a cash discount is a one-to-one trade. A dollar of perceived saving for the customer is a dollar of foregone contribution for the brand. The mechanic has no leverage in it. What the customer feels is exactly what the seller pays.

A gift with purchase, designed correctly, breaks the one-to-one trade in the following ways:

  • Increased perceived value: The customer perceives the gift at its retail value. The seller carries the gift at the Cost of Goods Sold (COGS) — typically thirty to forty percent of retail for consumables, and as low as twenty percent of retail for accessories. So one dollar of seller cost on a well-chosen Gift with Purchase (GWP) delivers three to five dollars of customer-perceived value. Same customer outcome. A third to a fifth of the campaign cost.
  • Moving dead stock: The mechanic compounds further when the gift is sourced from slow-moving inventory. A seasonal Stock Keeping Unit (SKU) sitting at the Third-Party Logistics (3PL) facility is accruing holding fees every month. Used as a GWP gift, that sunk inventory turns into a conversion driver. The campaign cost falls to near zero, and you clear dead stock as a bonus.
  • Increases average order value (AOV): The threshold does the third job. Setting a qualifying threshold above your current AOV — “Free gift on orders over $40” — pushes customers to add items to their cart to hit it. Those incremental items are revenue at near-full margin. The campaign is paid for by the AOV lift itself, not by your margin.

The math runs on the same six profit levers as any other campaign:

The Six Profit Levers in Ecommerce
  1. Product cost What you paid to have it made and shipped into your warehouse.
  2. Discounts Often used to convince strangers to buy from you because you do not have a big brand yet.
  3. Returns Not only the money the customer gets back, but also the cost of getting the item back into your warehouse and re-stocked.
  4. Warehousing and outbound shipping to the customer 3PL storage allocation, pick, pack, and the courier cost to the customer’s door.
  5. Ad spend to drive traffic to the online store Google Ads, Meta, and the rest of your paid channels.
  6. Payment processor and channel fees Combined at the platform’s rate — approximately 3% on Shopify and similar direct ecommerce, 15% on Amazon, Walmart and other marketplaces.

The GWP touches three of these in your favour. The Product cost lever moves up slightly (the gift’s COGS), but a small move. The Discounts lever does not move at all — the headline price stays where it is. The 3PL lever moves up by the small pack-out bump on a three-item shipment. Against that, the revenue line climbs sharply because the threshold has pulled an incremental item into the cart. This article will show you how to design a GWP so the math works in your favour every time.

1. Example showing you the numbers

Imagine you sell premium soy candles on Shopify. Your hero product is a hand-poured 8-ounce candle you retail at $30 per unit. With your standing 10% sitewide discount applied, the customer sees $27 at checkout. The story walks through two campaign options for driving conversion: deeper discount, or a gift with purchase at a qualifying threshold of $40.

When the standing 10% no longer cuts through, founders often double down to 20% off, dropping the checkout price from $27 to $24.

Conversion lifts modestly. But every order now earns $3 of contribution instead of $6. Half your contribution per order absorbed for a small uplift in orders.

Worse, you have started teaching your audience to wait for the next 20% off campaign. The standing 10% no longer feels like a deal — and your customers will hold off until the next bigger sale.

Per-order math at 20% off

Same single-unit cart. Deeper discount. Half the contribution per order.

Selling price (20% off $30)+$24
Product cost−$12
Ad spend−$4
3PL and outbound shipping−$3
Payment processor and channel fees (≈3%)−$1
Baseline returns−$1
Discount campaign contribution$3

Instead of cutting the headline price, you leave the candle at its BAU $27 and put a banner on the product page and cart: “Free limited-edition ceramic candle holder ($15 retail) on orders over $40.” Your current AOV is $27, so the threshold sits about fifty percent above it.

A customer arrives to buy the hero candle. They see the gift offer at the cart — a holder they would actually want, not a sample of what they are already buying. They add a 4-ounce candle from your range — retail $14, paid at $12.60 with the 10% sitewide — to reach the threshold. Their final cart: $40 paid for two candles AND the free limited-edition holder.

The math turns. The customer perceives a free $15 holder they will keep on top of a $14 second candle they were on the fence about. Your seller cost on the holder is $3 — its COGS at the accessory-typical 20% ratio. The incremental contribution from the added second candle covers the holder COGS and the small 3PL bump several times over. Contribution per qualifying order climbs to $8, two dollars above BAU.

Per-order math with the GWP mechanic

Three-item cart at $40 paid. Holder drawn from regular stock. Threshold-driven AOV lift of 48% per qualifying order.

Selling price (cart at 10% off)+$40
Product cost (hero candle)−$12
Product cost (added 4oz candle)−$6
Product cost (gift ceramic holder)−$3
Ad spend−$4
3PL and outbound shipping (3-item ship)−$5
Payment processor and channel fees (≈3%)−$1
Baseline returns−$1
GWP mechanic contribution$8

The Campaign Model

Four scenarios side by side. The first is Business As Usual (BAU) at the standing 10% sitewide discount. The next two are deeper discount campaigns. The fourth and fifth are GWP at a $40 threshold — once with a regular-stock limited-edition holder, and once with the same holder drawn from slow-moving inventory at zero marginal cost.

Per-order economics across BAU and four campaign options

All values stated as totals per order. The GWP columns reflect a 3-item qualifying cart at $40 paid: the hero candle, a $14 added 4oz candle, and the free $15-retail limited-edition ceramic holder.

Line Item BAU 10% off (no campaign) Campaign A: 20% off Campaign B: 30% off Campaign C: GWP regular-stock holder Campaign D: GWP slow-moving holder
Cart contents1 hero candle1 hero candle1 hero candleHero + 4oz + free holderHero + 4oz + free holder
Customer pays at checkout$27$24$21$40$40
Customer-perceived campaign valuen/aSaves $3Saves $6Free $15 holderFree $15 holder
Product (hero candle COGS)$12$12$12$12$12
Product (added 4oz candle COGS)$6$6
Product (gift ceramic holder COGS)$3$0
Ad spend$4$4$4$4$4
3PL and outbound shipping$3$3$3$5$5
Payment processor and channel fees (≈3%)$1$1$1$1$1
Baseline returns$1$1$1$1$1
Total brand cost$21$21$21$32$29
Brand contribution$6$3$0$8$11
The takeaway on gift with purchase
  • Cash discounts not as effective as GWP: A cash discount trades dollar-for-dollar between perceived value and contribution. A GWP at a threshold breaks the trade — five dollars of perceived value for one dollar of seller cost when the gift is a high-margin accessory like a limited-edition holder.
  • Perceived value of gift must be real: The gift must feel like an addition, not a downgrade. A sample of the hero product reads as a free taste; an accessory the customer will keep reads as a real gift. Choose accessories, limited-edition items, or complementary categories — not smaller versions of what they are already buying.
  • Average order value must increase: The threshold is where the contribution lift actually comes from. The incremental item the customer adds to qualify covers the gift’s COGS many times over. Using slow-moving inventory takes the ratio from five-to-one to infinite AND clears dead stock from the 3PL.

The cost stack across BAU and the four campaign options

Each bar is the brand’s revenue, broken into the cost layers from the bottom up. The green slice at the top is contribution. The two GWP bars climb higher because the cart revenue ceiling has lifted from $27 to $40 — and the contribution slice grows along with it.

2. How to design a profitable GWP

A GWP is not a discount in disguise. It is a perception arbitrage funded by the gift’s wholesale-to-retail markup, layered on a qualifying threshold that pulls an incremental item into the cart at near-full margin. This is how you should treat them:

Strategic reframe

A cash discount is a one-to-one trade. A GWP at a threshold is a three-to-one to five-to-one trade in the seller’s favour.

Funded by the gift’s COGS and the incremental cart item, not by your margin. Combined with slow-moving inventory, the ratio climbs to infinite and clears dead stock at the same time.

Six steps to design a GWP that pays for itself.

  1. Set the qualifying threshold thirty to fifty percent above your current AOV. Same rule as the free shipping threshold. Too low and no customers add items; too high and almost no one qualifies. If your AOV is $27, the threshold belongs somewhere between $35 and $45 — somewhere a customer can hit by adding one accessible second item from your range.
  2. Pick a gift the customer would actually want, not a smaller version of the hero. A 4oz sample of an 8oz candle reads as a tease, not a gift. A limited-edition ceramic candle holder, a brass match cloche with long matches, or a vanilla incense starter kit reads as a real gift — something to keep, display, or use alongside the hero product. The gift category should complement the hero, not echo it.
  3. Pick gifts from the high-margin end of your catalogue. Accessory and decor categories typically carry twenty to twenty-five percent COGS, giving you a four-to-one or five-to-one perceived-value-to-cost ratio. Consumable gifts at thirty to forty percent COGS deliver three-to-one. If your gift has higher COGS than your hero, the campaign math compresses and a cash discount becomes more cost-competitive.
  4. Use slow-moving or end-of-season SKUs as the gift wherever you can. Inventory already sitting at the 3PL accruing holding fees has had its COGS paid months ago. The marginal cost of using it as a GWP gift is near zero. You convert a sunk holding cost into a conversion driver and clear dead stock in the same campaign.
  5. Anchor the gift’s perceived retail value clearly on the product page and at the cart. “Free limited-edition $15 ceramic holder on orders over $40” gives the customer three anchors: what the gift is, its standalone retail price, and the threshold to reach it. A vaguely-described complimentary gift with no price anchor reads as cheap regardless of what it actually is.
  6. Tier the gift if you want to push customers further up the value ladder. “Free $15 holder over $40, premium $30 incense and holder bundle over $80” gives customers a second target to aim for. Tiered GWP campaigns can lift AOV by an additional ten to fifteen percent over single-threshold campaigns when designed well.

3. Frequently asked questions

How do I pick the right threshold?

Look at your current AOV and add thirty to fifty percent on top. If your AOV is $27, your threshold belongs between $35 and $45. Most brands find the sweet spot around forty to fifty percent above AOV — high enough to drive a genuine add-on, low enough that a meaningful share of customers will reach it. Run the math two ways before you commit: at the lower threshold, conversion to the gift will be higher but AOV lift smaller; at the higher threshold, fewer customers qualify but each qualifying order is bigger.

What makes a gift feel valuable rather than cheap?

Three properties are important to ensure the gift does not seem like a downgrade:

  • First, it is something the customer would keep, display, or use. Do not use samples of what they are already buying. A limited-edition ceramic candle holder reads as a real gift; a 4oz sample of an 8oz candle reads as a tease.
  • Second, it has a clear standalone retail price the customer can point to. The perceived value is anchored in something real.
  • Third, it ideally complements the hero product without echoing it. A holder for a candle, a snuffer set, a small incense starter kit. The gift extends the brand rather than miniaturizing it. Remember, if you sell candles and your gift is another candle, then one could argue that you are actually selling a bundle.

What if my gift has lower gross margin than my hero product?

The perceived-value-to-cost ratio depends on the gift’s gross margin. Accessories typically run at twenty to twenty-five percent COGS, delivering four-to-one to five-to-one ratios. Consumables run at thirty to forty percent COGS, delivering two-and-a-half to three-to-one. If your gift carries fifty percent or higher COGS, the ratio drops to two-to-one or worse — and a cash discount becomes more cost-competitive. Pick gifts from the high-margin end of your catalogue, or restrict GWP campaigns to high-AOV-lift thresholds where the incremental cart contribution carries the math.

What if I do not have any slow-moving inventory to give as gifts?

You can still run a GWP — the regular-stock version of the campaign earned eight dollars of contribution per order in the example above, still above BAU. The slow-moving variant takes the contribution per order from eight to eleven dollars and clears dead stock as a bonus. If you do not have slow-moving inventory, run the regular-stock version and look for opportunities to seed slow-moving SKUs (end-of-season samples, trade-show overruns, supplier sample programmes, limited-edition production overruns) for future campaigns.

Can I run a GWP and a discount at the same time?

Not without breaking the mechanic. The GWP’s contribution lift comes from the threshold pulling an incremental item into the cart at near-full margin. If you also discount the cart, you have given back the margin on the incremental item, and the gift’s COGS now eats into a smaller revenue base. Choose one or the other. If your goal is volume at thin margin, run a discount; if your goal is AOV lift at improved margin, run the GWP.

How does a Gift with Purchase differ from a bundle?

The two mechanics share a surface similarity — both involve multi-item carts and both lift AOV — but the underlying economics work in fundamentally different ways. A bundle reduces the headline price of a fixed combination of paid items; a GWP keeps headline prices flat and adds a free item triggered by cart size.

  • What the customer chooses: A bundle is a pre-packaged SKU the brand has assembled in advance — “3-pack of candles for $75.” The customer takes the bundle or doesn’t. A GWP is the customer assembling the qualifying cart themselves — “spend $40 and pick what you want.” Bundle is take-it-or-leave-it; GWP is build-your-own.
  • What is “free”: In a bundle, nothing is free. The customer pays one price for everything in the bundle; the deal is that the bundle price is lower than the sum of individual retails. In a GWP, one specific item — the gift — explicitly costs the customer zero. The other items are at full retail.
  • Inventory implications: A bundle pulls the same SKU deeper from inventory — three of the hero. A GWP consumes a specific gift SKU per qualifying order, which is where the slow-moving-inventory angle becomes powerful. You can’t really liquidate dead stock through a bundle without contorting the SKU structure; with a GWP, dead stock IS the campaign.
  • Where each works best: Bundles work best for consumable, repeat-purchase products where customers will use multiple units over time and the per-unit savings narrative lands cleanly. GWPs work best when you have a natural complementary accessory category (candles + holders, coffee + brewing accessories) or slow-moving inventory you want to clear.

How does this work on Amazon or Walmart?

Marketplace GWP is harder. Amazon does not have a clean native mechanism for bundling a free gift with a single SKU. Options include creating a bundle SKU that includes both products at a single price, using virtual bundles in Seller Central, or running the GWP as an inserted physical item in the shipment with a printed insert explaining it. On Walmart, similar constraints apply. The GWP mechanic is most powerful on your own Shopify or direct ecommerce store where you control the cart logic, the threshold, and the gift display.

4. Quick reference: what to avoid and what to apply

What to Avoid
  • Giving away a sample or smaller version of the hero product — it reads as a tease, not a gift.
  • Running a GWP without a qualifying threshold — the gift’s COGS eats into your margin with no incremental revenue to cover it.
  • Setting the threshold at or below current AOV — almost every customer qualifies without changing behaviour and the AOV lift never materialises.
  • Picking a gift with low gross margin — the perceived-value-to-cost ratio compresses and cash discounts become competitive on cost.
  • Stacking a discount on top of the GWP — the discount gives back the margin on the incremental item that funds the campaign.
  • Hiding the gift terms in the footer rather than on the product page and at the cart.
What You Should Do
  • Pick a gift the customer would keep, display, or use — accessories, limited-edition items, or complementary categories.
  • Set the qualifying threshold thirty to fifty percent above your current AOV.
  • Pick gifts from the high-margin end of your catalogue (4:1 to 5:1 retail-to-COGS ratio).
  • Use slow-moving or end-of-season inventory as the gift where you can.
  • Anchor the gift’s perceived retail value with a clear standalone price on the product page and at the cart.
  • Tier the gift to push customers further up the value ladder.
Definitions, modelling notes, and rate-basis disclosures Click to expand — benchmarks and assumptions used in the worked example above.
Definitions
  • Selling Price in this article is held at $30 per single unit (the premium soy candle) at full retail across all scenarios. The GWP scenario does NOT raise the headline price — the contribution lift comes from the threshold pulling an incremental cart item, not from the hero price moving.
  • The six profit levers in this framework: (1) Product (COGS), (2) 3PL and outbound shipping, (3) Ad spend, (4) Returns, (5) Discounts, (6) Payment processor and channel fees (combined).
  • Gift with Purchase (GWP) is a campaign mechanic where a free gift is added to qualifying orders above a defined threshold. The gift’s perceived retail value to the customer is the gift’s full retail price; the seller’s cost on the gift is its COGS. The gap between perceived value and seller cost is what makes the campaign more cost-efficient than a cash discount.
  • Qualifying Threshold is the cart value above which the free gift triggers. Best practice is to set it thirty to fifty percent above current AOV so customers add items to qualify.
  • Business As Usual (BAU) represents the brand’s baseline state — the standing 10% sitewide discount, no special campaign. The comparison anchor for evaluating any campaign mechanic.
  • Average Order Value (AOV) is the average cart total per checkout. A GWP threshold’s job is to lift AOV by giving the customer a reason to add items to the cart.
  • Cost of Goods Sold (COGS) is the landed product cost per unit — manufacturing plus inbound freight plus customs duty. Held at $12 for the hero candle and $3 for the $15-retail gift holder in this teaching model.
  • Stock Keeping Unit (SKU) is a single distinct product line in the brand’s catalogue. A “slow-moving SKU” is one accruing 3PL holding fees because it is not selling at its expected velocity.
  • Third-Party Logistics (3PL) is the outsourced warehousing and fulfilment provider. Charges include pick-and-pack labour per order plus storage allocation per month per SKU.
  • Slow-moving inventory is stock the brand already holds at the 3PL with the COGS paid months ago. The marginal cost of using one extra unit in a GWP shipment is near zero — pick fee changes by cents at most.
  • Contribution per Order is Sell Price minus all six lever costs. It is what is left to cover fixed costs and profit. The GWP mechanic is designed to raise contribution per qualifying order, not lower it.
Modelling notes
  • The GWP cart of $40 reflects a hero candle ($30 retail) plus a 4oz added candle ($14 retail), making $44 total retail. With the standing 10% sitewide discount applied, the customer pays $39.60, rounded to $40 for teaching clarity.
  • The perceived-value-to-cost ratio in the strategic reframe assumes accessory gifts at twenty to twenty-five percent COGS (4:1 to 5:1 ratio). Consumable gifts at thirty to forty percent COGS deliver 2.5:1 to 3:1. The ratio scales with the gift’s gross margin — high-margin accessories make GWP shine; low-margin consumables narrow the gap with cash discounts.
  • The slow-moving gift scenario holds the gift COGS at $0 because the inventory was already paid for and was accruing 3PL holding fees. If the inventory is not yet fully written off in your books, account for the GWP usage as inventory consumption at the original COGS for accounting purposes — but the marginal cash impact of including one extra unit in a shipment is near zero, which is what matters for campaign design.
  • 3PL and outbound shipping is held at $5 on the 3-item GWP cart versus $3 on the BAU single-item cart. The two-dollar bump reflects the additional pick-and-pack labour and slightly heavier packaging required for three units in one box.
  • Returns is held flat at $1 across all scenarios for teaching simplicity. In production, GWP carts may carry slightly higher absolute return cost because there are more items in the box, but the return RATE often falls modestly because customers who received a gift feel more generously treated. The net effect tends to be roughly flat.
  • The premium candle profile used here has 40% COGS and 60% Gross Profit at full retail. Different categories use different ratios.
Rate-basis disclosures
  • Product (hero candle COGS): $12 per unit at $30 retail (40% COGS).
  • Product (added 4oz candle COGS): $6 per unit at $14 retail (~43% COGS).
  • Product (gift ceramic holder COGS): $3 per unit at $15 retail (20% COGS, accessory-typical) in the regular-stock GWP scenario. $0 marginal in the slow-moving GWP scenario.
  • Ad spend: $4 per order — modestly higher than mass-market because premium candles typically attract higher ad CPMs. Held flat per ORDER, not per item, because the ad acquired the order, not each unit.
  • 3PL and outbound shipping: $3 per order on single-item BAU and discount carts; $5 per order on 3-item GWP carts to reflect the pack-out bump.
  • Payment processor and channel fees: approximately 3% of revenue on Shopify (2.9% plus 30 cents per transaction). Rounded to nearest dollar across scenarios for teaching clarity.
  • Baseline returns: $1 per order in this teaching model, held flat across scenarios for the reasons noted in modelling notes.

CronosNow: Numbers you can trust. Info you can use. Insights you can action.

Why free shipping thresholds pay for themselves in AOV lift (and how to set the right one)

Why free shipping thresholds pay for themselves in AOV lift (and how to set the right one)

The Problem with Treating Free Shipping as a Marketing Must

Most ecommerce founders have heard the same line: “everyone offers free shipping now. You have to too.” It is one of those pieces of advice that sounds true because so many sites display the badge. So they drop the shipping fee, write a press release about it, and absorb the cost.

The trouble is that free shipping is not a marketing posture. It is a discount mechanic. Specifically, it is a small dollar discount the seller hands the customer in exchange for clearing a price threshold. Set right, the customer adds to clear the threshold and the seller earns more contribution than they would have at the smaller cart with paid shipping. Set wrong, the seller gives away the shipping with no behavior change, and contribution drops by exactly that amount.

Most brands set the threshold wrong. They either set it at their current AOV (so customers were always going to clear it without changing behavior), or they set it so high that customers abandon at checkout. The middle band — where the threshold is high enough to drive a meaningful add-on but low enough that customers still complete the purchase — is narrow and worth modeling carefully.

This article walks through one supplements brand’s three-threshold test and the math behind it, so you can find the right band on your own numbers before you decide what to do with shipping.

Best viewed on desktop This article is built around full-width charts and data tables. On mobile they may appear truncated. For the complete picture, we recommend opening this page on a desktop or tablet in landscape mode.
What to Avoid
  • Offering free shipping at or below your current AOV — you give away shipping without buying any behavior change.
  • Treating free shipping as a "marketing must" without modeling the AOV impact in advance.
  • Setting the threshold so high that customers abandon at checkout.
  • Forgetting that the per-order costs (ad spend, 3PL pick, payment processor) stay flat whether the cart is $50 or $100.
  • Stacking a free shipping offer on top of a percentage discount campaign without re-running the contribution math.
What You Should Do
  • Model free shipping in Excel before launch — same six-lever model, with absorbed shipping treated as the discount lever.
  • Set the threshold 30 to 50 percent above your current AOV.
  • Watch conversion alongside AOV — both matter, and a threshold that lifts AOV but tanks conversion can net out negative.
  • Frame the threshold as a self-directed bundle: let the customer compose their own basket to clear it.
  • Test one threshold at a time so you can measure the impact cleanly.
Definitions and Modelling Notes Expand this section to get full insights into the definitions we use and the modeling notes that explain how we came to our figures.
Definitions
  • Gross Profit = Sell Price minus Cost of Goods Sold.
  • Contribution per Order = Sell Price minus the five operating cost lines (COGS, 3PL pick, ad spend, channel fees, returns) minus any discount applied. In this article the discount lever is "absorbed shipping" — the outbound shipping the seller eats when offering free shipping.
  • Absorbed Shipping = the outbound carrier cost the seller pays when offering free shipping above a threshold; equivalent to a discount lever in the six-lever model.
  • AOV (Average Order Value) = total revenue divided by total number of orders over a period — the metric that a free-shipping threshold is designed to lift.
Modeling notes
  • All costs in the tables below are stated per order (one customer checkout), not per unit.
  • Shipping rates are illustrative at $2.50–$3.50 for an idealized lightweight package; real DTC carrier rates for a small trackable parcel run $4 to $5.50 — adjust to your own bills when modeling. The lift conclusions are unaffected.
  • The 72 percent gross profit supplements benchmark matches Section 13.5 archetype data.
Rate-basis disclosures
  • Channel Fees: 4% of product cart for clean math; real processors (Shopify Payments, Stripe, PayPal) charge their percentage on the full captured amount including shipping, so the actual baseline channel fee is marginally higher than the model shows.
  • Returns: 3% of revenue, flat.
  • Ad Spend: $15 per order, flat — one cold-acquisition ad campaign drives one order regardless of cart size.
  • 3PL pick: $1.50 single unit base, stepping up to $2.00 on a heavier multi-item cart.

Olivia's Three-Threshold Test

Olivia's hero supplement — per-order economics at baseline (customer pays shipping)

These are the standing economics on her single bottle of multivitamin before any free-shipping policy. The customer pays $2.50 shipping pass-through. These numbers drive the cost stack in Section 2 and the threshold comparison in Section 3.

Line ItemPer-Order Value% of Sell Price
Sell price (bottle)$50.00100%
Shipping (customer pays, pass-through)+$2.50+5%
COGS$14.0028%
Gross profit$36.0072%
Ad spend$15.0030%
3PL pick$1.503%
Channel fees (4% of cart)$2.004%
Returns (3% of revenue)$1.503%
Contribution per order$16.0032%

Olivia runs a supplements brand on Shopify. She sells a single bottle of multivitamin at $50 — a high-margin product as the Core Economics table above shows. For years she charged $2.50 shipping at checkout, pass-through with no markup, and earned $16 of contribution per order.

A peer pushed her: "everyone offers free shipping now. You have to too." Olivia did not just drop the fee. She ran three tests in parallel.

Test one was free shipping at $50 — her current AOV. Result: nothing. Customers got the same $50 bottle they were already buying, and Olivia now absorbed the $2.50 shipping. Contribution dropped to $13.50. Pure cost, no payback.

Test two was free shipping at $75. About 60 percent of her customers added a $25 accessory to clear the threshold. AOV lifted to $75. Contribution per order went up to $29. The $3 of absorbed shipping (heavier package, slightly higher carrier rate) paid back at over four-to-one.

Test three was free shipping at $100. Some customers added a second bottle. Some paid shipping. Some abandoned. Average contribution per completed order beat baseline but missed Test two — abandonment cost real volume.

Olivia settled on the $75 threshold. The free shipping was not a discount. It was an AOV-lift mechanic that paid back four-to-one or better on the dollars absorbed.

The Six Profit Levers and Where Shipping Fits In

Every ecommerce sale moves the same six profit levers. Five are operating costs that move with the order. The sixth is the discount lever. In a percentage-off campaign, the sixth lever is the price cut. In a bundle, it is the bundle discount. In a free shipping threshold, it is the absorbed shipping — money the seller pays that the customer would otherwise have paid.

Olivia's Product-Only Cost Stack on a $50 Order

This chart shows Olivia's full-price cost split before any shipping is applied — five of the six profit levers plus the contribution slice. The sixth lever (shipping, absorbed or not) is what the rest of the article unpacks.

  • Cost of Goods and Returns scale per unit — both move with price and quantity sold.
  • Channel Fees scale with cart revenue.
  • Ad Spend and 3PL pick are per-order costs paid once, regardless of how many units are in the cart.
  • Outbound Shipping sits separately from the cost stack — in a paid-shipping baseline the customer covers it, and in a free-shipping scenario the seller absorbs it.

The question is what the customer does in response.

Free Shipping at Four Threshold Levels

Same product, same customer profile, four different shipping policies. The rightmost column is the gotcha — it shows the contribution lift versus the paid-shipping baseline.

Reading note: the rows below show isolated single-order scenarios — what one customer's checkout looks like under each policy. Your store's blended AOV under any rule will be an average across customers, some of whom clear the threshold and some of whom do not. The table isolates the unit economics; the real-world lift in your store scales by the percent of orders that actually clear.

Free Shipping Threshold Scenarios — per-order economics
ScenarioCart ValueShipping TreatmentOrder RevenueCOGS3PL pickOutbound ShipAd SpendChannel FeesReturnsContribution / OrderLift vs Baseline
Baseline (paid shipping)$50Customer pays $2.50$52.50$14.00$1.50$2.50 (cust pays)$15.00$2.00$1.50$16.00
Free ship at $50 (no AOV lift)$50Seller absorbs $2.50$50.00$14.00$1.50$2.50$15.00$2.00$1.50$13.50-$2.50
Free ship at $75 (modest lift)$75Seller absorbs $3.00$75.00$21.00$1.75$3.00$15.00$3.00$2.25$29.00+$13.00
Free ship at $100 (bigger lift)$100Seller absorbs $3.50$100.00$28.00$2.00$3.50$15.00$4.00$3.00$44.50+$28.50

Three patterns to read off the table.

The $50 row: customer behavior didn't change, so Olivia simply swallowed the $2.50 shipping. Contribution drops by exactly that amount. Pure cost, no payback.

The $75 row: the customer's $25 add-on carried about $9 of new variable costs ($7 COGS plus small increments in 3PL, channel fees, and returns), leaving $16 of new contribution. Subtract the $3 of absorbed shipping and you net $13 — a four-to-one payback on the shipping investment.

The $100 row: a $50 add-on generates roughly $32 of new contribution. Net of the $3.50 absorbed shipping, the lift is $28.50 — better than eight-to-one. Bigger AOV jumps generate bigger contribution payback, as long as the customer plays along.

The catch is in that last clause. Push the threshold too far above the natural cart and customers abandon. The next sections show how to find the band that lifts AOV without breaking conversion.

How the Cost Stack Changes as the Threshold Lifts AOV

The chart below shows the per-order cost stack across the four scenarios. Each bar's height is the order revenue, so the bars grow with AOV.

Per-Order Cost Stack — Free Shipping at Each Threshold

Each bar totals the order revenue. Ad Spend and 3PL pick stay roughly flat across the four bars. Contribution (green) grows as the threshold pulls more revenue through the same per-order cost base.

Two things to watch. Ad Spend (red) stays at $15 across every bar — one ad bought one order, regardless of cart size. 3PL pick (grey) and absorbed shipping (dark orange) creep up a dollar or two as packages get heavier, but nowhere near in line with revenue. The contribution slice (green) absorbs the difference: it widens dramatically as the threshold pulls more revenue per order through the same flat-ish per-order cost base.

How to Set Your Threshold Without Losing Sales

Five steps to set the threshold that lifts contribution without tanking conversion.

1. Know your AOV. Pull the average order value from your store analytics over the last 90 days. Strip outlier orders (very large B2B-style purchases) that distort the average. That number is your starting point.

2. Build the add-on tier first. The threshold only works if there is something obvious for the customer to add. If your catalogue is dominated by $50+ hero SKUs and you have nothing between $20 and $40, build that tier before you set the threshold. A $25 travel size, a $20 accessory, a $30 sample pack — these are what carry the customer from their existing cart to your threshold.

3. Set the threshold 30 to 50 percent above current AOV. If your AOV is $50, threshold $65 to $75. If your AOV is $80, threshold $105 to $120. This range is high enough to incentivize an add-on, low enough that most customers can clear it with one item from the add-on tier you built in step 2. Pushed higher than about 80 percent above AOV, customer abandonment starts to bite.

4. Model the math before launch. Six-lever model — five operating cost lines plus the absorbed shipping. Run contribution per order at the proposed threshold and the expected new AOV. If contribution comes out above baseline at modeled volume, ship the policy. If it stays flat or drops, tighten the threshold or build better add-on offers.

5. Test on a small segment. Watch both AOV and conversion. Run the threshold on one ad campaign or one email segment for two weeks. Industry benchmarks put the lift in a well-set threshold at 30 to 60 percent of orders adding to clear. If your test moves contribution per order up and conversion holds, scale. If conversion drops more than AOV gains compensate for, the threshold is too high — pull it down a notch.

Pro tip — Marketplace sellers

On Amazon, free shipping is mostly handled by the platform via Prime — most listings ship free above $35 with a Prime account, and the customer never sees the threshold as a seller-set decision. The threshold mechanic in this article applies most directly on Shopify and other DTC platforms where you control the checkout. On Amazon, the equivalent lever is your unit pricing relative to the $35 Prime free-ship break, plus participation in Subscribe & Save (which lifts AOV through repeat orders). On Walmart Marketplace, free shipping over $35 is a similar platform-set rule. Use this article's math as the framework, but plug the platform's threshold into the model.

CronosNow: Numbers you can trust. Info you can use. Insights you can action.