

The problem with pricing every product at the store average
Most founders model margins with one refund rate. The dashboard’s store average. Every product gets the same returns line. So every product looks safely profitable. The report feels exact. It is full of numbers.
But refund rates are not flat across a catalog. One product can come back four times as often as another. Same price. And the worst offenders are usually your “heroes.” They sell well. Their Gross Profit looks strong. So they lead every campaign. The refund damage hides in the store average. No product-level report ever shows it.
Each return costs more than it looks. A $100 order comes back. You do not just hand back $100. You pay about $5 to ship it back. And $2 to shelve it again. The $20 of ads that won the customer? Gone for good. One refund drains about $127. Your ’s Returns line shows only the first $100.
This article is about the second one: refunds. Of the six costs, it is the odd one out. It swings wildly between products at the same price. That swing is exactly what a store-average number erases.
1. An example showing you the numbers
Your store sells premium kitchenware on Shopify. 60 products. Most priced around $100. The dashboard shows a store refund rate of 5%. Right at the category norm. So your margin model applies 5% to every product. So every product shows the same healthy result. $10 left per order after all six costs.
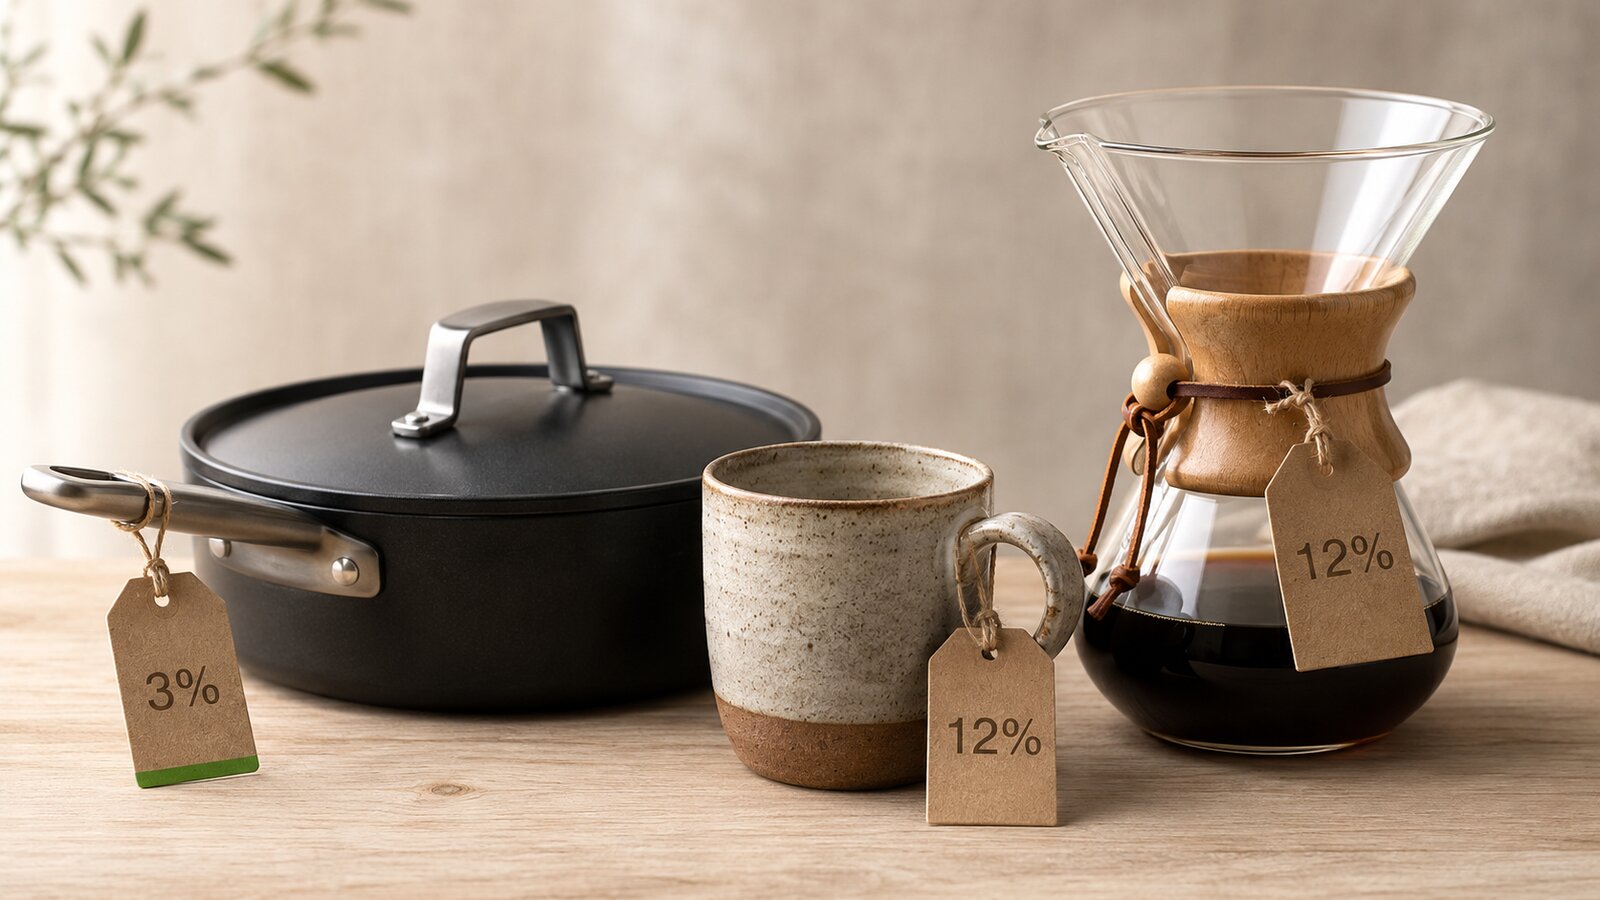
Then you pull 90 days of refund data, product by product. That means by . The spread is wild. Your saute pan returns at just 3%. A travel mug sits at 6%. And your two campaign heroes return at 12% each. A hand-thrown ceramic mug. A glass pour-over coffee maker. The comments say why. “Smaller than it looked.” “Arrived chipped.”
Every product starts from the same place. $100 price. $15 left after product cost, discount, ads, shipping, and fees. Only one line changes: refunds. Each return takes about $107 in cash. So each order’s refund cost is $107 times the product’s own rate. Watch what that one line does.
Same price, same costs, and a six-to-one gap in real profit
90 days of data. Each product’s refund cost is $107 times its own return rate, rounded to whole dollars.
| Line item | Saute pan | Travel mug | Store blend | Ceramic mug | Pour-over |
|---|---|---|---|---|---|
| Real refund rate | 3% | 6% | 5% | 12% | 12% |
| Margin before refunds | $15 | $15 | $15 | $15 | $15 |
| Refund cost per order | -$3 | -$6 | -$5 | -$13 | -$13 |
| What one order really leaves | $12 | $9 | $10 | $2 | $2 |
| What the dashboard says it leaves | $10 | $10 | $10 | $10 | $10 |
Read the highlighted row against the row below it. The dashboard swore every product left $10. In truth, the saute pan leaves $12. It deserves more ad budget, not less. The two heroes leave $2 each. You spent $20 of ads per order to win sales that keep $2.
Now scale it up. The ceramic mug and the pour-over do 200 orders a month each. The dashboard overstates their profit by $8 per order. That is about $38,000 a year. Profit that was never really there. Across just two products. No report showed it. They all used the store average.
One honest note. Your spread will not match this one. Some catalogs are tight. Others are wider. You cannot know which you have until each product’s own rate is in the math.
The sentence that changes how you think about product-level refunds
Two products with the same price tag can be two different businesses once their real refund rates are in the math.
In this example, a $100 pan kept $12 per order. A $100 mug kept $2. A six-to-one gap the store average hid completely. Your gap will differ. The hiding works the same way.
2. How to build a product-level refund margin model
This is a two-hour spreadsheet job. The output is one table. What every product really leaves per order. And which ones the store average covered for.
- Pull 90 days of refund data by product. Sort by refund rate, highest first. Skip products with fewer than 20 units sold. The rate is too noisy to trust. Cover the products that make up at least 80% of your revenue.
- Build one cost stack per product. Start with the selling price. Take away product cost, discount, ads, shipping, and fees. That is the . Then take away the refund cost at the product’s own rate. Not the store average. That is what each order really leaves.
- Flag everything far from the store blend. Products leaving 20% less than the blended number need a fix. Products leaving 20% more are quiet heroes. They may deserve more ad budget than the dashboard ever suggested.
- Pick the right fix for each flagged product. Reprice when the product is good but the price ignores its return habit. Redesign the page or packaging when buyers pick the wrong thing. Or when it arrives damaged. Retire only when neither works. High-return sellers often bring customers who buy other things.
- Re-run the model every quarter. Refund rates drift. New products launch. Last quarter’s fix changes this quarter’s list. Put the 90-day refresh in your calendar. Act on the new flags.
3. One warning before you act
Under 20 products? The store average is usually good enough. A handful of products rarely spreads wide enough to mislead you. And small sales volumes make product-level rates jumpy. Do not reprice anything off a rate built on 15 units.
And do not kill the 12% products on sight. They may feed the rest of the store with new customers. Try the cheaper fixes first. Give each a fair test window before you judge.
4. Frequently asked questions
How big does my catalog need to be for this to matter?
Under 20 products, the blended rate is usually fine. Between 20 and 100, the model starts to show real gaps. Above 100 products? You almost surely have items returning at three to four times your average. There the model is a must.
I do not know my advertising cost per product. Does that break the model?
No. Use your average. Total ad spend over 90 days divided by total orders. Refunds are the cost that varies most between same-price products. So the model still finds the gaps. Refine the ad numbers later.
Does this work on Amazon?
Yes. Use the Return Reports by Amazon Standard Identification Number (ASIN). And the Voice of the Customer dashboard. Both show each listing’s real return rate. Build the same table on each ASIN’s rate. Not the storefront average. The fixes differ, A+ Content, packaging, but the method is the same.
Should I just retire the high-return products?
Not as a first move. High-return products are often high-volume sellers. They bring customers to your brand. Reprice first. Or fix the page and the packaging. Retire only when a fair test shows neither lever moves the rate.
5. Quick reference: what to avoid and apply
What to avoid
- Applying the store-average refund rate to every product’s margin model.
- Trusting the “hero product” report, strong Gross Profit can hide a 12% return habit.
- Acting on refund rates built from fewer than 20 units sold.
- Retiring a high-return product before trying repricing or a page redesign.
- Building the model once and never refreshing it, rates drift every quarter.
What you should do
- Pull 90 days of refund data by product, sorted by refund rate.
- Give every product its own refund line: $107-style cash cost times its own rate.
- Compare what each order really leaves against the store-blend number.
- Move ad budget toward the quiet heroes the dashboard underrated.
- Re-run the model every 90 days and act on the new flags.
Want your six costs mapped for you?
Our free 31-Point Profit Diagnostic puts a dollar figure on where your profit is leaking. Or get a quote for done-for-you eCommerce accounting.
Definitions, modeling notes & rate-basis disclosures
Definitions
- The six profit levers
- (1) Discounts, (2) Refunds, (3) Product cost (landed COGS), (4) Sales channel and payment fees, (5) Shipping and 3PL fees, (6) Advertising spend.
- Stock Keeping Unit (SKU)
- One distinct product in your catalog, as your inventory system tracks it.
- Blended refund rate
- Refunds as a share of sales across the whole store. Useful for tracking. Dangerous for pricing: it hides the product-level spread.
- Margin before refunds
- Selling price minus product cost, discount, ads, shipping, and fees. On this store’s $100 order, $15.
- Refund event cost
- Everything one return costs: the $100 given back, about $5 return shipping, about $2 restocking, plus the $20 of ads already spent. About $127 on a $100 order.
- Contribution per order
- Selling price minus all six costs. The money one sale really leaves behind.
- Halo effect
- When one product brings in customers who go on to buy others. The reason not to retire a popular high-return product too fast.
- Profit and Loss (P&L) statement
- The report of your revenue and costs. Its Returns line shows refunded revenue only.
Modeling notes
- This article uses the series’ standard teaching store: a $100 average order, product cost $40, standing 10% discount, advertising $20 per order, shipping and 3PL $12, payment and channel fees 3%. It varies only the refund lever, product by product: 3%, 6%, and 12% against the standard 5% blend.
- Refund cost per order: each return costs about $107 in cash ($100 back + $5 return shipping + $2 restock). Per order that is $107 times the product’s rate: $3 at 3%, $5 at 5%, $6 at 6%, $13 at 12%, rounded to whole dollars. The $20 of lost ads is already counted in the advertising line.
- Margin before refunds: $100 − $40 − $10 − $20 − $12 − $3 = $15. What one order leaves: $15 − $3 = $12 (pan), $15 − $6 = $9 (travel mug), $15 − $5 = $10 (blend), $15 − $13 = $2 (ceramic mug and pour-over).
- The blind spot: the dashboard overstates the two 12% products by $8 per order. At 200 orders a month each, that is $8 × 400 × 12 = $38,400 a year, rounded to $38,000 in the body.
Rate-basis disclosures
- Category baseline: kitchenware returns run at roughly 3% to 5%. This store’s blend is 5%.
- Return shipping: $5 per returned order. Restocking: $2 per returned unit.
- Problem-product volume: 200 orders per month each for the ceramic mug and the pour-over.
- All figures rounded to whole dollars for easy reading.