

The problem with managing refunds as one big number
Most founders watch one refund number. “We are at 12% this quarter. Last quarter was 13.” The number wiggles. Someone suggests stricter rules. Or better photos for the whole store. The cycle repeats. It feels like management. It rarely moves the number.
Here is why. Refunds do not spread evenly across your products. They pile up. A store at 12% is usually three products coming back at 20-something percent. They hide among dozens of products at 4%. Fix the whole catalog and you waste months. Fix the three and the number drops.
The one-big-number view hides something else: what a refund really costs. A $100 order comes back. You do not just hand back $100. You pay about $5 to ship it back. You pay $2 to shelve it again. And the $20 of ads that won that customer? Gone for good. One refund drains about $127. The Returns line on your shows you only the first $100.
This article is about the second one: refunds. They hit you twice. Once in the money you give back. Once in the ads you already paid. Both are real. Only one shows up in the number you watch.
1. An example showing you the numbers
You run an apparel store on Shopify. You carry 240 products. Your average order is $100. Your refund rate is 12%, right on the industry average. So it feels fine.
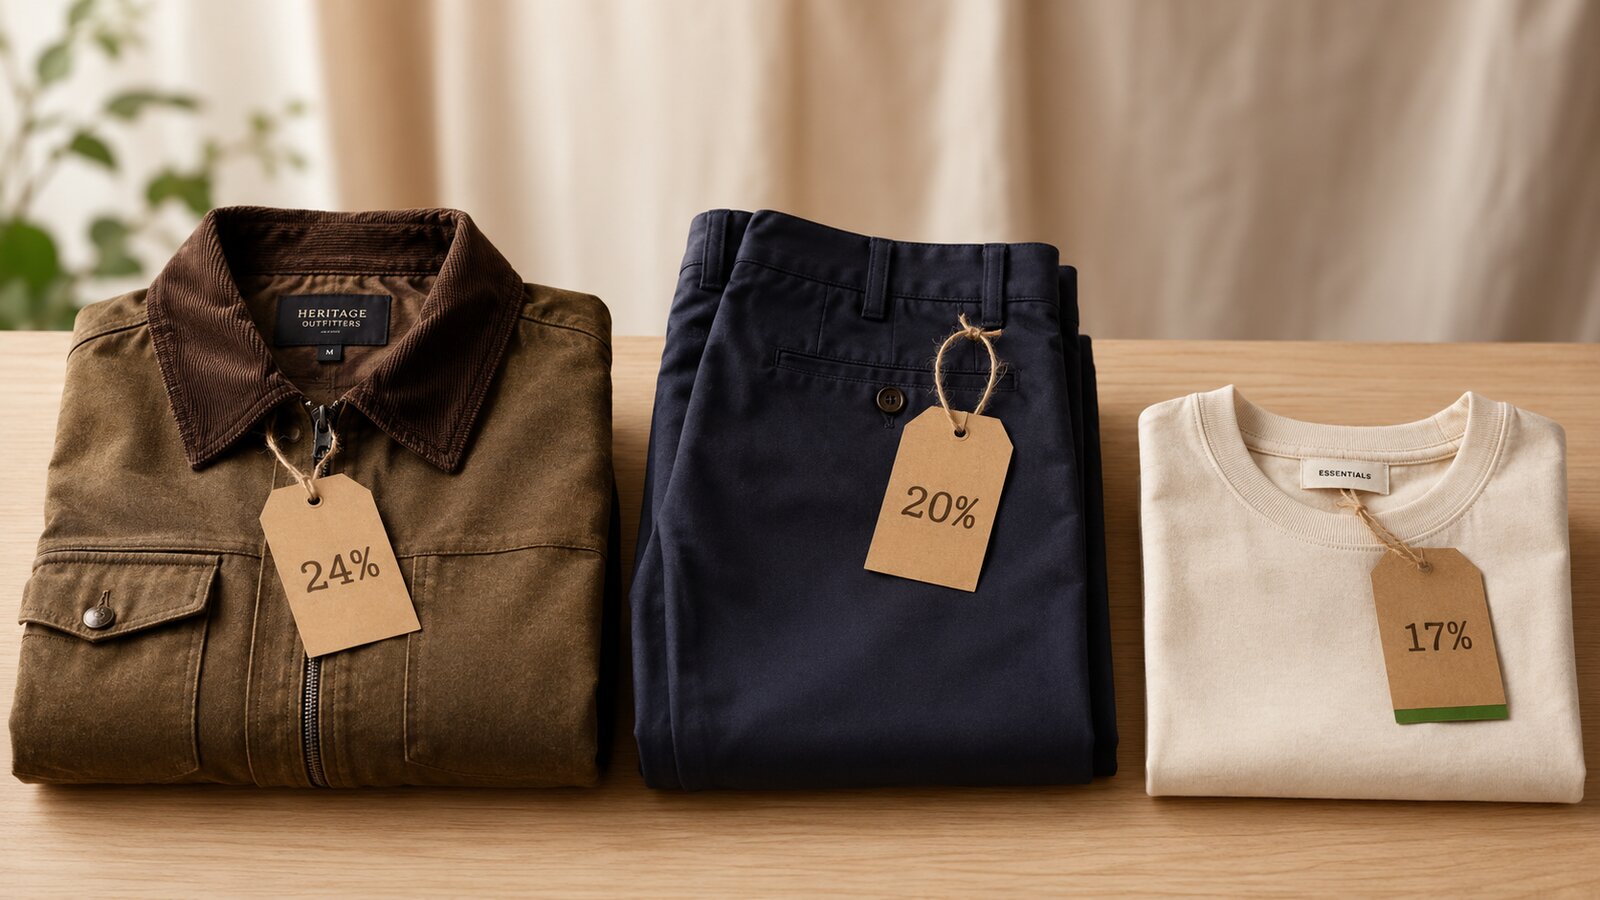
Then you pull 90 days of refund data, product by product. Three products jump off the page. A jacket coming back at 24%. A trouser at 20%. A tee at 17%. Together they are less than half your sales. But they are more than 80% of your refund dollars. The customer comments explain why. Sleeves too long. Cut too slim. Tee shorter than the photo.
Over six weeks you rebuild just those three pages. New photos on models of different heights. Real measurements. Fit labels: slim, relaxed, true to size. That is all. No policy change. No new rules for customers.
Three products were hiding inside the 12% average
90 days of data. The other 237 products were healthy all along.
| Line item | Jacket | Trouser | Tee | Other 237 | Whole store |
|---|---|---|---|---|---|
| Share of units sold | 17% | 18% | 12% | 53% | 100% |
| Share of refund dollars | 35% | 30% | 17% | 18% | 100% |
| Return rate before the fix | 24% | 20% | 17% | 4% | 12% |
| Return rate after the fix | 14% | 14% | 14% | 4% | 9% |
The store rate falls from 12% to 9%. Now watch your money. At 12%, refunds cost about $13 of every $100 order. The store kept just $2 per order after all six costs. At 9%, refunds cost about $10. Now the store keeps $5.
That is $3 more profit on every order. More than double. On 2,000 orders a month, those three pages are worth $72,000 a year. The other 237 products were never the problem. You never touched them.
The sentence that changes how you think about refunds
You do not have a refund problem. You have a “three-product” problem hiding inside an average.
It will not always be exactly three. For you it might be one, two, or five. The point is this: a few products almost always cause most of the damage. Fix that handful. Leave the rest alone. This store went from keeping $2 per order to $5, by rewriting three product pages.
2. How to run your own product-level refund audit
One person. About two hours. You are hunting for the few products hiding behind your average. Then the customer comments tell you why they come back.
- Pull 90 days of refund data, product by product. Shopify, BigCommerce, and WooCommerce all export refunds by line item. Sort from the most refund dollars to the least. Skip products that sold fewer than 20 units. Too little data to trust.
- Circle the top three to five by refund dollars. Sort by dollars, not rate. A 30% return rate on a product that sold 10 units matters less than 15% on one that sold 500. Dollars tell you where your time pays.
- Read 20 customer comments for each one. Do not skim. The pattern usually shows up within minutes. Fit. Sizing. Color. “Smaller than expected.” The words customers use are the words missing from your product page.
- Fix one product page at a time. Measure for two weeks. Better photos. Real measurements. Fit labels. Honest reviews up front. Check the return rate actually fell before moving on. Fix all three at once and you will never know what worked.
- Leave the long tail alone. Re-audit every quarter. Almost all the gain lives in the top three to five products. And the list changes. New products launch. Seasons shift. Put the 90-day audit in your calendar.
3. One warning before you act
Do not chase a 0% refund rate. Some returns are the healthy cost of selling clothes people have not tried on. Tighter return rules usually backfire. Strict rules scare off good buyers at checkout. The sales you lose cost more than the refunds you prevent.
Fix the product pages first. Touch the policy last, if at all.
4. Frequently asked questions
My refund rate is already below the industry average. Do I still need this?
Yes. A healthy average can still hide one product coming back at 22%. The audit takes two hours. If it finds nothing, you have proof your catalog is clean.
What if customers return a product because it is genuinely faulty?
The audit will catch that too. The comments will say “broken” instead of “too small.” The fix is different, take it up with your maker or your warehouse’s inspection step. The hunt is the same: sort by refund dollars, read the comments.
Does this work on Amazon?
Yes. In Seller Central, the Voice of the Customer dashboard and the Return Reports show returns and reasons for each product. Fix the product pages of the worst offenders first, exactly as above.
Wouldn’t a shorter return window be faster than fixing pages?
Faster, but weaker. And it costs you sales. A tight window mostly annoys unhappy customers into keeping items. It scares new buyers away at checkout. And the real cause, a page that over-promises, stays broken.
5. Quick reference: what to avoid and apply
What to avoid
- Managing refunds as one store-wide average, the damage hides in a few products.
- Tightening the return policy as a first move, it costs sales and skips the real cause.
- Sorting by return rate alone, a high rate on tiny volume is a distraction.
- Skipping the customer comments, they hand you the fix in the customer’s own words.
- Fixing every product page in the catalog, the long tail is not the problem.
What you should do
- Pull 90 days of refunds by product, sorted by refund dollars.
- Circle the top three to five products; ignore anything under 20 units sold.
- Read 20 customer comments per problem product before deciding the fix.
- Fix one product page at a time and measure for two weeks each.
- Re-audit every quarter, the problem list changes as the catalog changes.
Want your six costs mapped for you?
Our free 31-Point Profit Diagnostic puts a dollar figure on where your profit is leaking. Or get a quote for done-for-you eCommerce accounting.
Definitions, modeling notes & rate-basis disclosures
Definitions
- The six profit levers
- (1) Discounts, (2) Refunds, (3) Product cost (landed COGS), (4) Sales channel and payment fees, (5) Shipping and 3PL fees, (6) Advertising spend.
- Refund event cost
- Everything one return costs: the $100 given back, about $5 return shipping, about $2 restocking, plus the $20 of ads already spent on the order. About $127 on a $100 order.
- Blended refund rate
- Refunds as a share of sales across the whole store. Fine for tracking. Bad for finding the cause: it hides which products do the damage.
- Contribution per order
- Selling price minus all six costs. The money one sale really leaves behind.
- Profit and Loss (P&L) statement
- The report of your revenue and costs. Its Returns line shows refunded revenue only. Not the return shipping, restocking, or lost ads.
- Third-Party Logistics (3PL)
- The warehouse company that ships orders out and shelves the ones that come back.
Modeling notes
- This article uses the series’ standard teaching store: a $100 average order, product cost $40, standing discount 10%, advertising $20 per order, shipping and 3PL $12, payment and channel fees 3%.
- Refund cost per order: each return costs about $107 in cash ($100 back + $5 return shipping + $2 restock). At 12 returns per 100 orders, that spreads to about $13 per order. At 9 per 100, about $10. The $20 of lost ads is already counted in the advertising line.
- Contribution per order: $100 − $40 − $10 − $20 − $12 − $3 − $13 = $2 before the fix. The refund line falls to $10 after, leaving $5. Yearly lift: $3 × 2,000 orders × 12 months = $72,000.
- The before/after store rates (12% and 9%) are rounded from the product-weighted math for easy reading.
Rate-basis disclosures
- Category baseline: 12% blended return rate, the apparel industry average published by the National Retail Federation (NRF).
- Return shipping: $5 per returned order. Restocking: $2 per returned unit.
- Store volume: 2,000 orders per month at $100 average order value.
- All figures rounded to whole dollars for easy reading.