

The problem with adding products and never removing them
Founders add products and almost never remove them. Every new flavor feels like growth. Every removal feels like a step back. So the catalog only grows. Each product takes a shelf slot and ties up cash, whether it sells or not.
When founders check the catalog, they check margins. Margins usually look fine. The slow half often earns nearly the same margin per unit as the fast half. So both halves look healthy.
That is the trap. Top and bottom rarely differ on margin. They differ on speed, how fast stock turns back into cash. A slow product hides behind a healthy margin while it locks up money your winners could use.
This article is about the third one: product cost. Every unit on your shelf is cost you already paid, cash locked up until it sells. The slower a product moves, the longer your money sits still. A catalog audit finds the products holding your cash and sets it free.
1. An example showing you the numbers
You run a sports nutrition and coffee brand. Creatine, pre-workout, whey protein, hydration packs, plus a small coffee line. Four years of new flavors and formats have grown the catalog to 69 products. Pull 120 days of sales and one fact jumps out. Only 24 really move. The other 45 are dead stock, still listed, still shelved, barely selling.
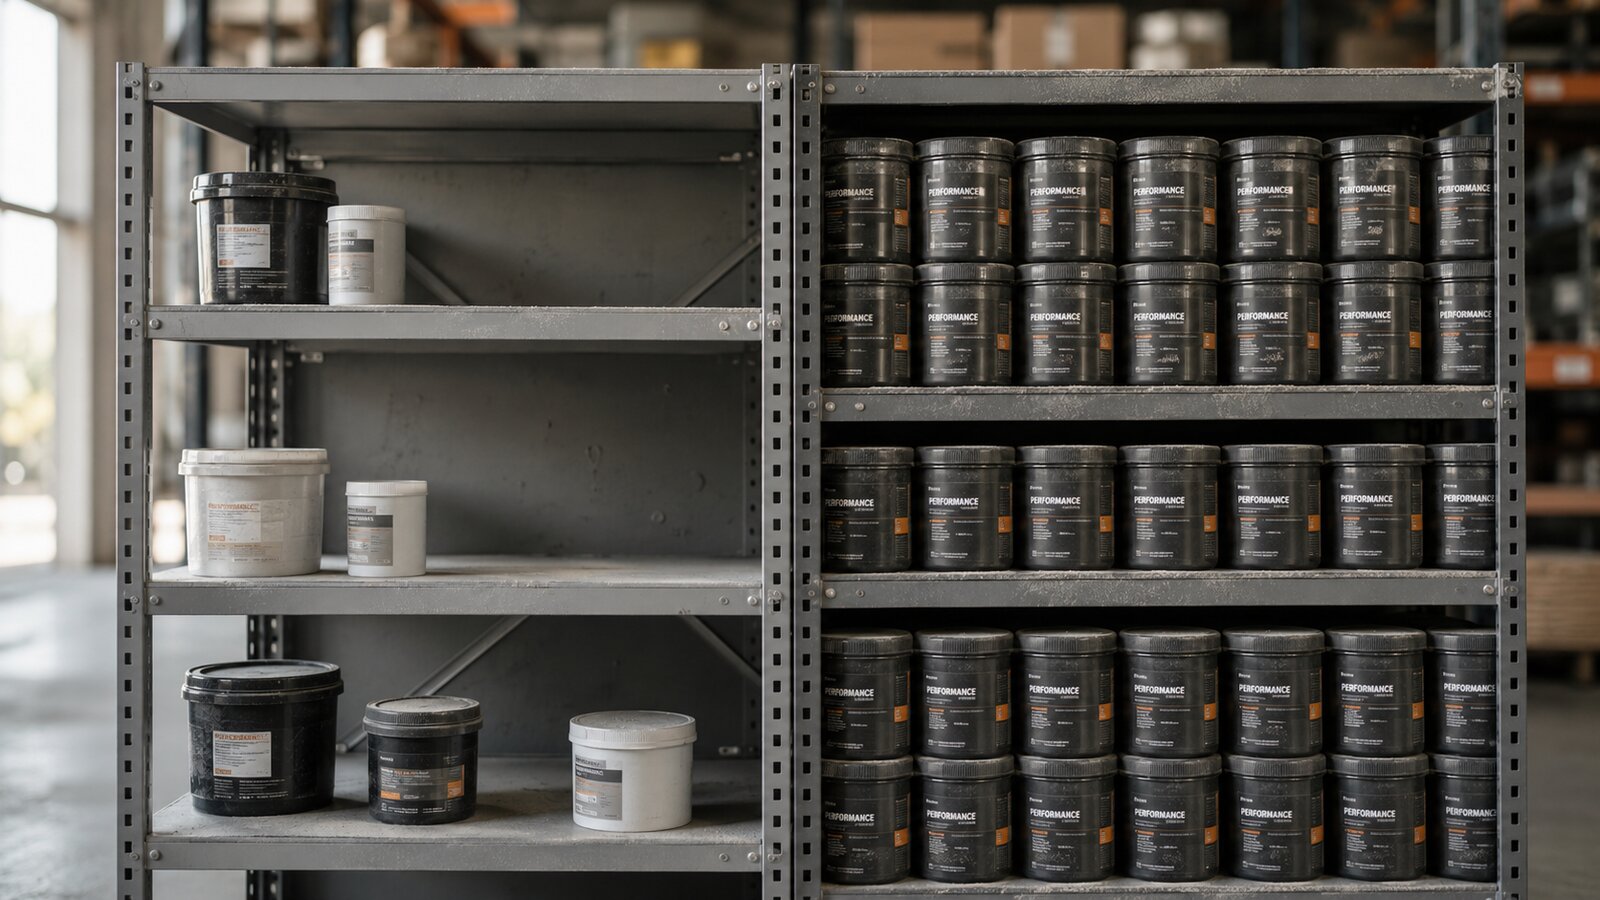
The dead 45 are the easy cleanup. The real question is the 24 that move. Take two: a tub of pre-workout and a bag of specialty coffee. Both sell for $100. Both cost $40 landed. Both leave $60 of . On a margin report, they are twins.
Now watch them move. The pre-workout sells through about six times a year. One $40 slot earns $60 six times over, $360 of Gross Profit a year. The coffee turns about twice: $120 from the same slot. Same price. Same margin. One shelf makes three times the money.
Split the 24 movers into halves by profit, top 12 and bottom 12. Here is your last 120 days.
Top 12 vs bottom 12 products, a 120-day catalog audit
All figures cover 120 days, about one quarter. Every product at the house numbers: $100 price, $40 landed cost.
| Line item | Top 12 | Bottom 12 | The gap |
|---|---|---|---|
| Units sold in 120 days | 6,000 | 2,000 | top sells 3× more |
| Gross Profit in 120 days (× $60) | $360,000 | $120,000 | top makes 3× more |
| Units sitting on the shelf | 3,000 | 3,000 | identical |
| Cash tied up in stock (× $40) | $120,000 | $120,000 | identical |
| Days of stock cover | 60 days | 180 days | bottom is 3× slower |
| Gross Profit per $1 of stock | $3 | $1 | top is 3× better |
| Stock turns per year | about 6 | about 2 | top turns 3× more |
Margin cannot tell these halves apart. Every product makes $60 on $100. Speed can. The bottom 12 hold as much cash as the top 12, $120,000, and earn a third of the profit. A top-half dollar brings back $3 of Gross Profit in 120 days. A bottom-half dollar brings back $1.
Now the payoff. Cap the bottom half’s reorders until it holds 60 , like the top. That is 1,000 units instead of 3,000. As reorders roll through, that releases 2,000 units × $40 = $80,000 of cash. Delist the dead 45 too. The audit frees a six-figure sum.
One honest note. The bottom 12 are not automatic dead weight. Their $120,000 of Gross Profit is real money. Some are seasonal. Some anchor a category. Some are new. So do not cut half your catalog on sight. Decide product by product: keep, cap, or cull.
The sentence that changes how you think about your catalog
Your catalog is a portfolio, not a museum. A slow product does not earn its shelf by matching your best sellers’ margin, it has to match their speed.
Cash sitting in slow stock is cash you cannot spend on the products that already work. In this example, the same $120,000 of stock earned $360,000 in one half of the catalog and $120,000 in the other.
2. How to run your own 120-day catalog audit
Once the data is pulled, this is a one-hour spreadsheet job. The output: one decision per product, keep, cap the reorder, run down, or cull.
- Pull the last 120 days of sales by product. You need three columns: units sold, revenue, and landed cost per unit. 120 days smooths weekly noise but still shows current demand. Thirty days is too jumpy. A year reacts too slowly.
- Rank every product by Gross Profit dollars, not margin. Units sold × (price minus landed cost). Percentages hide the problem. A slow product can match your best seller’s margin while earning a tenth of the dollars. Rank on dollars, top to bottom.
- Add days of stock cover to every line. Units on hand ÷ average daily units sold. Healthy fast movers sit at 60 to 100 days. Over 200 is a red flag. Over 365 is dead stock in slow motion.
- Sort every product into four buckets. Keep and reorder: top sellers that must never stock out. Keep with a cap: fine products, smaller batches. Run down: stop reordering, sell through, decide again. Cull: tiny profit on a big pile, delist and clear it.
- Delist the dead, then re-audit every quarter. Mark dead stock down, bundle it, or sell it off in bulk. Do not reorder it. Repeat every quarter. Catalogs drift. Seasons shift.
3. One warning before you act
We are not saying cut everything slow. Some slow products matter in ways a ranking cannot see. A flagship that anchors the brand. A seasonal flavor out of season. A new launch. Or a data glitch from a stock-out. Ask why a product is slow before you touch it. Ask your team, not just the spreadsheet.
Culling is not instant cash either. The stock still has to sell through. The freed cash arrives as you stop reordering, over one or two cycles. Plan the wind-down. Do not torch a customer favorite for a quick shelf.
4. Frequently asked questions
What if my highest-margin product sits in the bottom half?
It happens a lot. Margin does not save it if the units do not move. Ask which product earns the most per dollar of stock. If the slow one matters, keep it, but cap the reorder so it holds less cash.
When do I cull a product versus promote it harder?
Ask why it is slow. Good product but invisible: promote it. Demand moved on: run the stock down. Quality complaints: cull it, no marketing fixes that. The audit finds the slow. The why decides.
What about seasonal products?
Audit them inside their season. Or use a 12-month window with a note. A summer flavor audited in December looks dead. In July it looks fine. Never let a winter audit cull a summer product.
What if I do not want a smaller catalog?
A fair plan, some brands compete on breadth. Then cap reorders instead of cutting. Order 500 units instead of 1,500. Most of the cash comes free. The catalog your customers see stays the same.
5. Quick reference: what to avoid and apply
What to avoid
- Judging catalog health on margin percentage, it cannot see speed.
- Treating all products as equal because they all show a profit.
- Culling a slow product without asking why it is slow.
- Clearing dead stock overnight instead of over a reorder cycle or two.
- Auditing once and never again, catalogs drift every quarter.
What to apply
- Pull 120 days of sales by product: units, revenue, landed cost.
- Rank every product by Gross Profit dollars earned in the window.
- Add days of stock cover to every line and flag anything over 200.
- Sort into four buckets: keep, cap, run down, cull.
- Put the freed cash into the products that already work.
Want your six costs mapped for you?
Our free 31-Point Profit Diagnostic puts a dollar figure on where your profit is leaking. Or get a quote for done-for-you eCommerce accounting.
Definitions, modeling notes & rate-basis disclosures
Definitions
- The six profit levers
- (1) Discounts, (2) Refunds, (3) Product cost (landed COGS), (4) Sales channel and payment fees, (5) Shipping and 3PL fees, (6) Advertising spend.
- Stock Keeping Unit (SKU)
- One distinct product listing. 69 SKUs means 69 flavor-and-format combinations to manage.
- Landed Cost of Goods Sold (COGS)
- The full cost of one unit in your warehouse: factory price plus freight, duty, and clearance. Held at $40 on every $100 product here.
- Gross Profit
- Selling price minus landed COGS: $60 on every $100 product in this example.
- Days of stock cover
- How long your on-hand stock lasts at the current sales rate: units on hand divided by average daily units sold.
- Stock turn
- How many times a year stock sells through and gets replaced.
Modeling notes
- This article uses the series’ standard teaching store: every product sells for $100 with landed COGS of $40, $60 Gross Profit per unit. The other five levers run at house rates, the same for both halves. So the ranking uses Gross Profit and speed.
- Reconciliation: top 12 sold 6,000 units in 120 days (50 a day) with 3,000 on hand, 60 days of cover, 6,000 × $60 = $360,000 Gross Profit. Bottom 12 sold 2,000 (about 17 a day) with 3,000 on hand, 180 days, $120,000. Stock cash: 3,000 × $40 = $120,000 per half.
- Per-dollar returns: $3 of Gross Profit per $1 of stock per 120 days on top ($360,000 ÷ $120,000) and $1 on the bottom. Turns: 365 ÷ 60 ≈ 6 and 365 ÷ 180 ≈ 2. Freed cash: 180 → 60 days of cover releases 2,000 units × $40 = $80,000.
- The catalog shape (69 SKUs, 24 moving, 45 dead) follows a real sports nutrition and coffee audit. Dollars restated on the house card.
Rate-basis disclosures
- Catalog: 69 SKUs listed; 24 with meaningful sales in the 120-day window; 45 effectively dead.
- Every active product modeled at the house card: $100 price, $40 landed COGS, $60 Gross Profit.
- Top 12: 6,000 units sold in 120 days, 3,000 on hand. Bottom 12: 2,000 sold, 3,000 on hand.
- Cash freed: $80,000 when bottom-half cover drops from 180 to 60 days (2,000 units × $40).
- All figures in US dollars, rounded to whole dollars.